
Friday morning at 8am, you're staring at your flour inventory. Monday's order needs to go in, but Saturday and Sunday could swing wildly different ways. Order too much and you're sitting on expensive inventory that might spoil. Order too little and you're driving to Restaurant Depot at 5am Sunday morning, paying retail prices and scrambling to keep up.
Most bakery demand forecasting advice tells you to track everything—weather patterns, local events, seasonal trends, competitor analysis. Sure, in theory that works. But when you're running a 3-person operation and baking starts at 4am, you need something that actually fits into your workflow.
Dozens of bakeries struggle with this exact problem. They're overthinking the complex stuff while missing the basic building blocks. You don't need a crystal ball. You need day-of-week multipliers built from your own sales data, safety stock rules that match your actual variability, and an ordering cadence that syncs with your suppliers' schedules.
Why generic forecasting breaks down for small bakeries
The fundamental disconnect happens because bakeries operate on extremely tight timelines with perishable inventory. A coffee shop can hold extra beans for weeks. A sandwich shop can freeze proteins. But when your sourdough starter needs feeding and your croissants need laminating butter at exactly the right temperature, your margin for error shrinks to hours, not days.
Traditional restaurant forecasting assumes relatively stable weekday patterns with weekend bumps. Bakeries see extreme swings—a Saturday farmers market might drive 3x your Tuesday sales, while Monday could be dead because half the neighborhood works from home. These aren't small variations you can absorb with extra inventory. They're massive operational shifts that affect everything from staff scheduling to oven capacity.
Your flour comes from a regional mill that delivers Mondays and Thursdays. Your dairy supplier only takes orders 48 hours in advance. Your specialty chocolate needs a week's notice. Each supplier runs on their own timeline, and you're juggling all of them while trying to predict what customers will want four days from now.
Most forecasting tools assume you can order anything, anytime. That's not how small bakery supply chains work. You're locked into specific ordering windows, minimum quantities, and delivery schedules that don't care about your Sunday brunch rush.
The 6-week snapshot approach (why more data often makes things worse)
Using 6-12 weeks of data often produces better forecasts than using 6 months. Sounds backwards, but there's solid operational logic behind it.
Never miss a bake or delivery again.
Bakeryly helps you schedule, track, and manage every order effortlessly.
- Unified order tracking
- Real-time inventory alerts
- Staff shift management
No credit card required
Bakery demand shifts faster than most food businesses. A new apartment complex opens nearby. A competitor closes. Summer vacation starts. These changes happen quickly and dramatically affect your sales patterns. When you average 6 months of data, you're including patterns that no longer exist.
Take a bakery near a university. September through May shows strong Tuesday-Thursday sales from students. But if you're forecasting for July using annual averages, you'll massively over-order mid-week items. The 6-week window captures your current reality without the noise of outdated patterns.
The math stays simple enough to do without specialized software:
Week 1-6 Daily Sales Tracking:
-
Monday
$420, $380, $445, $390, $410, $425
-
Tuesday
$510, $490, $520, $505, $515, $500
-
Wednesday
$540, $560, $530, $545, $555, $550
-
Thursday
$580, $590, $570, $585, $575, $595
-
Friday
$890, $920, $880, $910, $900, $895
-
Saturday
$1,420, $1,380, $1,450, $1,410, $1,430, $1,400
-
Sunday
$1,180, $1,220, $1,160, $1,200, $1,190, $1,210
Average these out and you get your baseline week. But more importantly, you can now see the multipliers:
Day-of-Week Multipliers (compared to weekly average):
-
Monday
0.58x
-
Tuesday
0.69x
-
Wednesday
0.74x
-
Thursday
0.80x
-
Friday
1.22x
-
Saturday
1.93x
-
Sunday
1.61x
These multipliers become your forecasting foundation. When you know next week's total expected sales (from pre-orders, catering, or seasonal patterns), you can distribute it across days using these ratios.
Building day-of-week multipliers from item-level sales
The aggregate multipliers give you the big picture, but ingredient forecasting needs item-level precision. A Saturday might be 1.93x your average day overall, but croissant sales could spike 2.5x while bread stays at 1.4x.
Sourdough Loaves Daily Pattern:
-
Monday
12 units average
-
Tuesday
14 units average
-
Wednesday
15 units average
-
Thursday
16 units average
-
Friday
24 units average
-
Saturday
38 units average
-
Sunday
32 units average
Croissants Daily Pattern:
-
Monday
18 units average
-
Tuesday
22 units average
-
Wednesday
24 units average
-
Thursday
26 units average
-
Friday
45 units average
-
Saturday
78 units average
-
Sunday
65 units average
Croissants spike harder on weekends than sourdough. This reflects different customer behaviors—weekend brunch crowds versus weekly bread shoppers. These item-specific patterns determine your actual ingredient needs.
Now map these items back to ingredients. Sourdough uses flour, water, salt. Croissants need flour, butter, eggs, milk. When you apply the day-of-week multipliers to each item, then sum up the ingredient requirements, you get accurate forecasts that reflect your actual sales mix.
Keep this simple enough to maintain. Don't track 50 items individually. Focus on your core products that drive 80% of ingredient usage.
Safety stock rules that match bakery realities
Generic safety stock formulas assume normal distribution of demand and consistent lead times. Neither applies to small bakeries. Your demand clusters around weekends. Your lead times depend on which driver shows up from your supplier.
Variance by Day of Week: Look at your 6-week data again, but now calculate the standard deviation for each day:
-
Saturday sales
$1,420, $1,380, $1,450, $1,410, $1,430, $1,400
-
Range
$70 (about 5% of average)
-
Monday sales
$420, $380, $445, $390, $410, $425
-
Range
$65 (about 16% of average)
Monday varies more as a percentage even though Saturday has higher absolute variance. Your safety stock should reflect this—proportionally more buffer for volatile days.
Practical Safety Stock Calculation:
-
Calculate maximum daily usage from your 6-week history
-
Note your typical order-to-delivery time
-
Add 20% buffer for high-variance days (Mon, Tue)
-
Add 10% buffer for stable days (Fri, Sat, Sun)
Example with all-purpose flour:
-
Max daily usage
50 pounds (busy Saturday)
-
Order-to-delivery
2 days
-
Weekend buffer
50 × 2 × 1.1 = 110 pounds
-
Add Monday variance buffer
+20 pounds
-
Safety stock target
130 pounds
Focus your extra buffer on days with high percentage variance rather than just absolute variance.
This keeps enough flour to survive a surprise rush without tying up cash in excessive inventory.
Syncing orders with supplier schedules
Real bakeries don't order whenever they want. They work within supplier constraints that drastically affect forecasting strategy.
Map out your actual supplier schedules:
| Supplier | Order Days | Delivery Days | Lead Time | Minimum |
|---|---|---|---|---|
| Flour Mill | Mon, Thu | Wed, Sat | 48 hours | 200 lbs |
| Dairy | Daily | Next day | 24 hours | $150 |
| Specialty | Tuesday | Following Mon | 6 days | $500 |
| Produce | Mon, Wed, Fri | Tue, Thu, Sat | 24 hours | $75 |
Here's a quick workflow visualization:
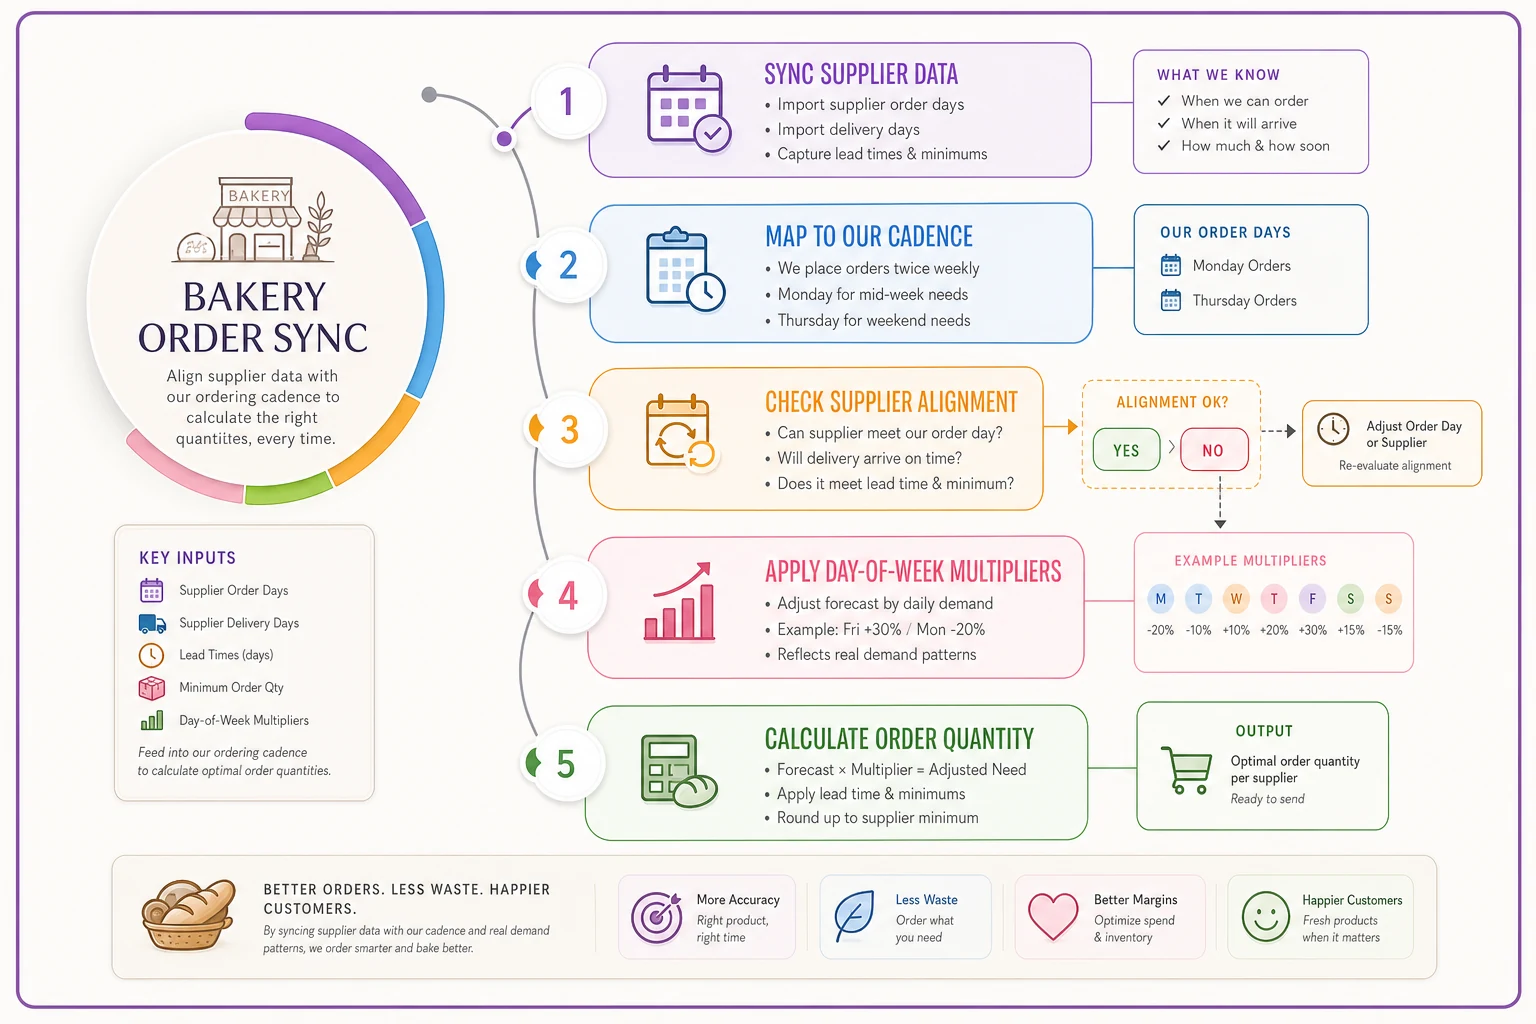
This flow shows how supplier windows and multipliers determine order quantities.
-
Monday order
covers Wed, Thu, Fri demand
-
Thursday order
covers Sat, Sun, Mon, Tue demand
The Thursday order spans your biggest and smallest days. This is where your multipliers become crucial. You know Saturday needs 1.93x average, Sunday needs 1.61x, Monday drops to 0.58x, and Tuesday rebounds to 0.69x.
-
Sum the multipliers
1.93 + 1.61 + 0.58 + 0.69 = 4.81
-
Multiply by average daily flour use
30 lbs × 4.81 = 145 lbs
-
Add safety stock buffer
145 + 15 = 160 lbs
-
Round up to supplier packaging
175 lbs (7 bags × 25 lbs)
This systematic approach means you're never guessing. You know exactly why you're ordering 175 pounds instead of 150 or 200.
When the forecast meets reality: adjustment triggers
Even solid forecasts hit unexpected reality. Build specific triggers that tell you when to override the forecast:
Pre-order Spike Trigger: If Thursday pre-orders exceed 150% of your recent Thursday average, add 25% to your Friday and Saturday forecasts. Customers who pre-order often bring friends or return for impulse purchases.
Weather Adjustment Rules:
-
Rain on Saturday
reduce forecast by 20%
-
First sunny Saturday after winter
increase by 30%
-
Holiday weekend
increase Friday by 40%, Saturday by 20%
Inventory Depletion Signals:
-
If 30% of items gone by noon
increase tomorrow's production by 15%
-
If less than 10% sold by 2pm
decrease tomorrow by 20%
These aren't random adjustments. A bakery that sells out of croissants by 10am on Saturday will almost certainly see higher demand on Sunday as word spreads.
The Wednesday checkpoint system
Wednesday becomes your weekly forecasting checkpoint. Far enough into the week to see patterns emerging, but early enough to adjust weekend orders.
-
Compare Mon-Wed actual sales to forecast
-
Check weekend pre-orders
-
Review weather forecast
-
Scan local event calendars
-
Adjust Thu-Sun forecasts if actuals vary >15% from plan
This checkpoint catches problems before they cascade. If Monday and Tuesday ran 20% below forecast, you probably need less inventory for the weekend. If pre-orders for Saturday custom cakes doubled, you need extra butter and eggs beyond the normal Saturday spike.
The discipline of a weekly checkpoint beats constantly second-guessing your forecasts. You make adjustments once, clearly, based on data, then execute the plan.
Moving from spreadsheets to systematic forecasting
Most bakeries start with paper notes or basic spreadsheets. That works until you're juggling multiple suppliers, tracking dozens of ingredients, and trying to remember whether last Saturday was busy because of weather or the art fair.
The progression usually looks like:
-
Paper tracking of daily sales
-
Spreadsheet with weekly totals
-
Spreadsheet with day-of-week patterns
-
Multiple sheets for different suppliers
-
Realizing you need an actual system
AI-powered operational software designed for food businesses makes the jump from nice-to-have to necessary. Not because spreadsheets can't do math—they can. But because forecasting isn't just math. It's workflow integration, supplier coordination, and pattern recognition across weeks of data.
Modern bakery management platforms automatically calculate your day-of-week multipliers from POS data, adjust safety stock based on actual variance, and sync ordering windows with supplier schedules. The AI automation handles the number crunching while you focus on the judgment calls—like whether that new coffee shop opening across the street will boost or hurt your morning pastry sales.
The real value isn't in the forecasting algorithm itself. It's in having forecasts automatically flow into purchase orders, production schedules, and prep lists. When your Wednesday checkpoint shows you need 20% more croissants for Saturday, the system adjusts not just the croissant count but the butter order, the prep schedule, and the Saturday morning staff plan.
Testing your forecasts (without risking your business)
Before trusting any forecasting method with real money, run it in parallel with your current approach. Track what the forecast says versus what you actually order. After 2-3 weeks, you'll see if the systematic approach beats your intuition.
Most bakeries find the forecast slightly under-predicts Saturday demand and over-predicts Monday. That's fine—now you know to add 10% to Saturday and cut 10% from Monday. The point isn't perfection; it's having a consistent baseline to adjust from.
Keep a simple accuracy log:
-
Monday
Forecast 40 lbs flour, Used 38 lbs ✓
-
Tuesday
Forecast 48 lbs flour, Used 51 lbs ✓
-
Wednesday
Forecast 52 lbs flour, Used 49 lbs ✓
-
Thursday
Forecast 55 lbs flour, Used 58 lbs ✓
-
Friday
Forecast 85 lbs flour, Used 92 lbs (adjust +8%)
-
Saturday
Forecast 140 lbs flour, Used 152 lbs (adjust +8%)
-
Sunday
Forecast 115 lbs flour, Used 112 lbs ✓
After a few weeks, patterns emerge. Maybe you consistently under-forecast butter because you forget about prep waste. Maybe egg usage spikes on Sundays because of quiche specials. These insights refine your multipliers into increasingly accurate predictions.
The compound effect of better forecasting
A 10% improvement in forecast accuracy might not sound dramatic, but the operational impact compounds. Less emergency supply runs at retail prices, fewer stockouts during peak periods, reduced ingredient waste from over-ordering, better staff scheduling from predictable production needs, improved cash flow from optimized inventory levels.
For a bakery doing $8,000 in weekly sales, reducing waste by 10% and emergency purchases by 50% often means $400-600 more in monthly profit. That's without selling a single additional item—just operational efficiency from better forecasting.
The bigger gain is psychological. When you're not constantly scrambling to cover shortages or watching expensive ingredients expire, you can focus on what matters: recipe development, customer service, and growing the business. The mental bandwidth recovered from systematic forecasting often matters more than the financial gains.
Start with the 6-week snapshot and day-of-week multipliers. Add safety stock rules based on your actual variance. Sync with your supplier schedules. Build in a Wednesday checkpoint. Run it parallel to test accuracy. Then refine based on results. It's not about predicting the future perfectly—it's about having a systematic method that learns from your specific patterns and gets incrementally better each week.
Ready to elevate your bakery operations?
Join 2,000+ bakeries using Bakeryly to streamline workflows, reduce waste, and delight more customers.