

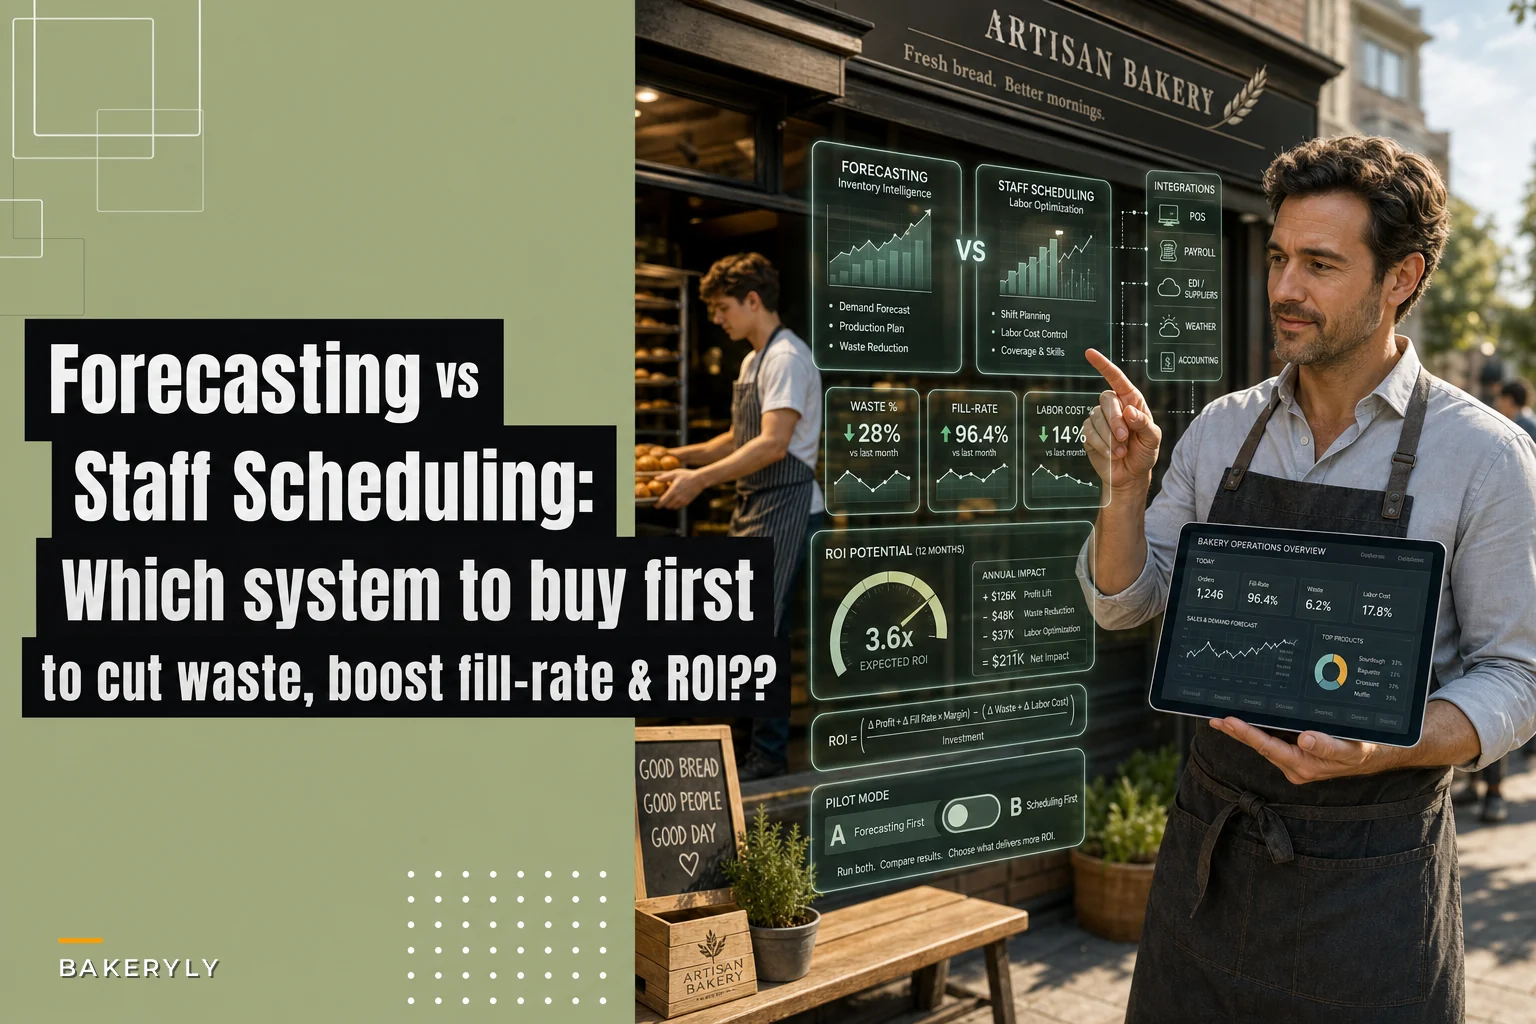

Most bakeries can realistically only implement one operational system at a time. The two that keep coming up are inventory forecasting (how much to bake and buy) and staff scheduling (who works when). They feel related, and vendors love to bundle them, but they solve different problems, need different data, and pay back on different timelines.
The mistake I keep seeing: an owner buys the forecasting tool because waste is visible and painful, when the bigger leak was actually a scheduling problem — or vice versa. This piece is built as a decision tool. Both system types go side by side, KPIs get defined precisely with actual formulas, the causal chain from system output to real dollars gets traced out, and you get pilot designs that actually isolate whether the thing worked.
If you're worried about depending too heavily on a single vendor's model, it's worth reading the companion piece on practical contingency steps when AI model rollouts get limited alongside this.
The Core Tradeoff, Stated Plainly
Forecasting systems reduce waste and stockouts. Scheduling systems reduce labor cost and understaffing. Both are demand‑driven, but they act on different levers with different failure modes.
| Dimension | Inventory Forecasting | Staff Scheduling |
|---|---|---|
| Primary KPI moved | Waste %, unit fill‑rate | Labor cost per unit, coverage |
| Secondary effect | Stockouts, ingredient spend | Overtime, morale, service speed |
| Main input | SKU‑level sales history, yields, expiry | Demand curve by daypart, shift types, wages |
| Time granularity | Daily / per‑bake‑batch | 15–30 min blocks |
| Payback speed | Faster (waste is immediate cash) | Slower (labor changes are sticky) |
| Failure mode | Over‑bake or empty shelves | Understaffed mornings, overtime creep |
| Data quality needed | High (yields + expiry matter) | Medium (needs a decent demand signal) |
| Political friction | Low (nobody defends waste) | High (people's hours are personal) |
The honest summary: forecasting usually pays back faster and creates less internal conflict. Scheduling has a higher ceiling in labor‑heavy operations but is harder to implement because you're touching people's paychecks.
What Each System Actually Needs
This is where most implementations quietly fall apart. The tool is fine; the inputs are garbage. Before you evaluate a single vendor, check whether you can actually produce the data below.
Never miss a bake or delivery again.
Bakeryly helps you schedule, track, and manage every order effortlessly.
- Unified order tracking
- Real-time inventory alerts
- Staff shift management
No credit card required
Inventory Forecasting — Required Inputs & Schema
``
saledatetime        (timestamp, not just date)
skuid
skuname
qtysold
unitprice
channel              (cafe / online / wholesale)
locationid          (for multi-site)
voidsreturnsflag
``
``
skuid
batchrecipeid
batchyieldunits    (e.g. 1 dough batch = 42 croissants)
ingredientid
qtyperbatch
unitofmeasure
``
``
skuid
productiondatetime
sellablehours       (e.g. laminated pastries = 8h prime)
markdownhour        (when it drops to discount price)
disposal_hour
``
Without the expiry fields, a forecaster will happily tell you to bake to total daily demand and completely ignore that half of it needs to sell before 11am. That's how you end up with a "correct" forecast that still produces afternoon dumpsters full of croissants.
Staff Scheduling — Required Inputs & Schema
``
locationid
date
daypartblock        (15 or 30 min)
transactions
itemssold
avgservice_time     (optional but valuable)
``
``
employeeid
role                 (front / production / cleanup)
hourlywage
overtimethreshold
maxhoursweek
availabilitywindows
crosstrainedroles
``
``
shiftcode
starttime / endtime
minstaff / maxstaff
requiredroles
``
One pattern worth calling out: bakeries almost always have production labor driven by tomorrow's bake plan and front labor driven by today's foot traffic. If your scheduling tool treats them as a single pool, it'll over‑optimize the front and starve the ovens at 4am.
KPI Formulas — Defined So You Can Actually Calculate Them
Vague KPIs are why most dashboards get ignored after the first month. Here are the exact definitions.
``
Waste % = (value of unsold + disposed units) / (value of total produced) × 100
``
``
Fill-rate = units sold / units demanded
``
``
CSL = number of bake cycles with no stockout / total bake cycles
``
``
Labor cost/unit = total labor cost (period) / total sellable units produced (period)
``
``
MAPE = mean( |actual - forecast| / actual ) × 100
RMSE = sqrt( mean( (actual - forecast)^2 ) )
Bias = mean( forecast - actual )
``
Watch bias most closely. A model with decent MAPE but positive bias is systematically telling you to overbake — that's a waste machine wearing a lab coat. Negative bias means chronic stockouts. MAPE tells you how wrong; bias tells you which direction you're bleeding.
The Causal Chain: From System Output to Real Dollars
This is the part vendors gloss over. A forecast number doesn't save money. The decision it changes does.
Forecasting → waste reduction follows a four-step chain:
-
Model outputs a per‑SKU production quantity for tomorrow.
-
Baker trusts it enough to bake to it (adoption is the weak link — more on this below).
-
Lower over‑production means fewer units hit disposal_hour unsold.
-
Waste % drops, and ingredient spend and disposal labor drop with it.
The chain breaks at step 2 more than anywhere else. If the head baker doesn't trust the number, they add a "safety" 15% buffer and the gain is gone before the oven even opens. This isn't a technology problem — it's a trust problem that needs to be solved operationally, not with a better algorithm.
Forecasting → fill‑rate improvement works the same model, different angle. The system reduces stockouts by getting the distribution right, not just the average. A forecast that nails total volume but misses the weekend spike still empties your shelves Saturday at 10am. Fill‑rate only improves when the model captures the shape of demand, not just the total.
Scheduling → labor cost per unit:
-
Demand curve predicts a slow Tuesday 2–4pm.
-
Schedule trims one front‑of‑house shift to match.
-
Labor hours fall without hurting service, because demand really was low.
-
Labor cost per unit drops.
The failure mode here is cutting hours where demand looked low but service time was already stretched. You save $40 in labor and lose a $200 catering inquiry because nobody could answer the phone. That trade-off doesn't show up in any dashboard.
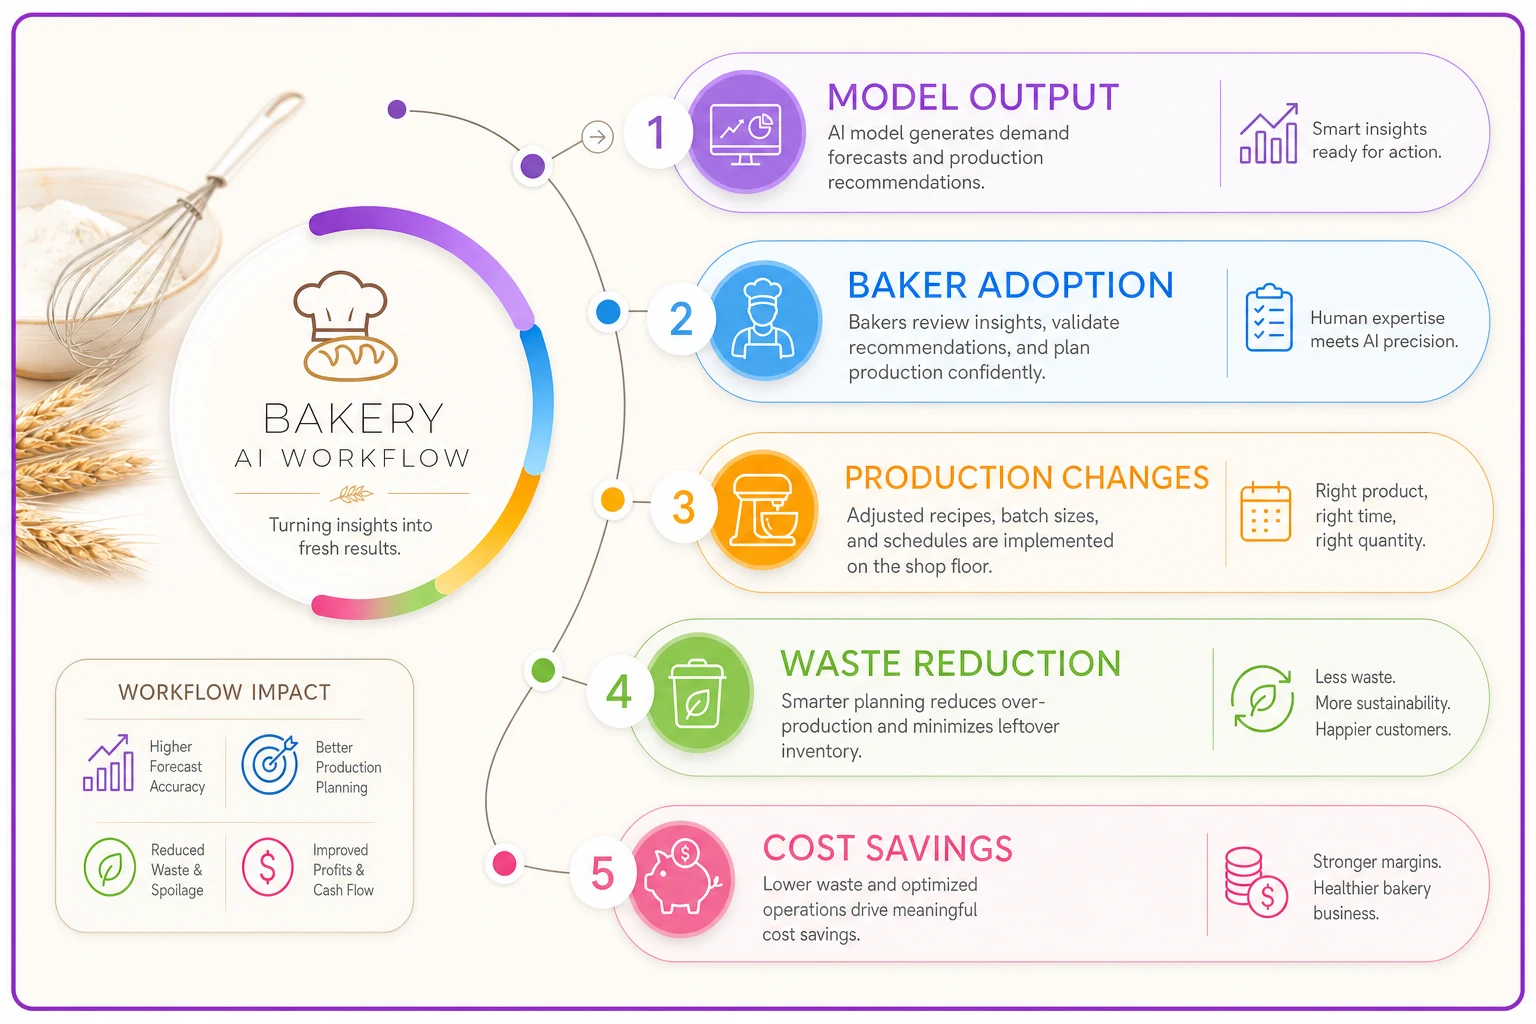
A simple workflow diagram showing the path from model output → baker adoption → production changes → waste reduction → cost savings.
Implementation Checklist (Works for Either System)
Confirm POS exports timestamped, SKU‑level data (not daily totals)
Build the yield table for your top 20 SKUs first — they're roughly 80% of volume
-
Confirm POS exports timestamped, SKU‑level data (not daily totals)
-
Build the yield table for your top 20 SKUs first — they're roughly 80% of volume
-
Add expiry/sellable‑window fields even if approximate
-
Pull 12+ months of history if you have seasonality; 6 months minimum
-
Clean out promo days and closures (they poison the baseline)
-
Define your KPI baselines before go‑live — you can't prove ROI without them
-
Pick a single pilot SKU set or a single daypart — don't try to do everything at once
-
Assign one person who reviews outputs daily for the first month
-
Set alert thresholds (see below)
-
Agree on an export format for lock‑in protection (see below)
Agree on an export format for lock‑in protection (see below)
Integration Touchpoints
Forecasting connects to: POS (sales history + live sales), supplier ordering (EDI or API to convert forecast into a purchase order), and your production sheet.
Scheduling connects to: POS (demand signal), payroll (hours into wages and overtime rules), and time‑clock data (actual vs scheduled — critical for catching schedule drift).
One integration people consistently forget: feeding actuals back in. A forecasting or scheduling system with no closed loop on what actually happened can't improve over time. Make sure yesterday's real sales and real clocked hours flow back in automatically. Manual re‑entry dies within three weeks, every time.
Dashboard Widgets & Alert Thresholds
Keep the dashboard to what actually drives a decision this week.
Forecasting dashboard:
-
Waste % by SKU, 7‑day trend — alert if any SKU > 12% by value
-
Bias by SKU — alert if |bias| trends positive 3 days running
-
Fill‑rate on top 10 SKUs — alert if hero SKU < 92%
-
Stockout timestamp log — alert if flagship hits zero before 11am
Scheduling dashboard:
-
Labor cost % of revenue by day — alert if > target band
-
Scheduled vs actual hours — alert on >10% drift
-
Overtime hours — alert on any unplanned OT
-
Coverage gaps by daypart — alert if any block falls below min_staff
One rule worth holding to: if an alert doesn't map to a specific action someone takes, delete it. Alert fatigue kills more dashboards than bad data does.
Proving It Actually Worked: Pilot Designs
Don't trust a vendor's "customers see 30% less waste." Test on your bakery.
A/B by SKU (forecasting): Split your SKUs into matched pairs by volume and perishability. Run the model on half, keep manual on the other. Compare waste % after 4–6 weeks. Simple, clean, hard to argue with.
Difference‑in‑differences (multi‑site): Roll the system out at Site A, keep Site B as control. Measure the change in waste or labor at A minus the change at B over the same window. This nets out seasonality and market shifts that would otherwise trick you into crediting the software for just having a good month.
Daypart A/B (scheduling): Apply optimized schedules to mornings, keep afternoons on your old method for a few weeks, then swap. Measure labor cost per unit and any service complaints in each window.
Run pilots for at least 4 weeks. A single good week proves nothing in a business this seasonal.
ROI and Payback — Realistic Ranges
Rough guidance from what these systems tend to deliver, heavily dependent on data quality:
| Bakery Size | Forecasting Payback | Scheduling Payback |
|---|---|---|
| Single site, low data quality | 6–12 months | 9–15 months |
| Single site, clean POS data | 3–6 months | 6–10 months |
| Multi‑site, clean data | 2–5 months | 4–8 months |
A workable single‑site example: a café bakery doing roughly $45k–$55k monthly revenue with waste sitting around 9–11% of production value. Cutting that to the 5–7% range frees up somewhere in the $1,500–$2,500 per month range. Against a tool costing a few hundred a month, that's a clean payback inside a quarter — if the head baker actually bakes to the numbers.
Scheduling on the same bakery is murkier. If labor is already tight, the tool might recover a few hundred a month — real, but not dramatic. Labor savings get bigger as a share of revenue in high‑footfall, longer‑hours operations.
The single biggest ROI variable is data quality. A bakery with timestamped SKU data and a real yield table consistently gets 2–3x the return of one feeding daily totals into the same tool.
Sensitivity Analysis — What Breaks the Math
Three variables tend to quietly wreck the ROI math before you notice.
-
Perishability
The shorter your sellable window, the more forecasting is worth — and the harder it is to get right. Highly perishable lines punish over‑baking instantly.
-
Oven/batch constraints
Forecasts assume you can bake exactly the recommended quantity. If your minimum batch is 42 croissants and the model says 31, you're overproducing by design. A good system respects batch granularity; a naive one ignores it entirely.
-
Supplier lead‑time
Longer lead times force earlier ordering decisions off less certain forecasts, widening safety stock and eating into waste gains.
Run your ROI at both optimistic and pessimistic ends of these variables before committing to anything.
Avoiding Vendor Lock‑In
Whatever you buy, insist on:
-
Full data export in CSV or Parquet — your sales, yields, schedules, and the model's own predictions
-
An API or scheduled export you control, not a "contact support to export" situation
-
Keeping your own copy of the yield and expiry tables outside the vendor system
If a vendor can't hand you your own forecast history and actuals in an open format, that's a red flag regardless of how polished their dashboard looks.
The Two Manual Templates (Start Here Before Buying Anything)
Run these for a month before spending on software. If you can't extract value from a spreadsheet, software won't rescue you.
Run these for a month before spending on software.
The "five‑number" manual forecast (per SKU, per day):
-
Base = average units sold, same weekday, last 4 weeks
-
Trend = up/down adjustment vs prior 4 weeks (±%)
-
Event = known adjustment (holiday, promo, weather)
-
Cap = round to nearest full batch
-
Forecast = (Base × Trend × Event), rounded to Cap
Track forecast vs actual every day. After two weeks the bias pattern becomes obvious.
Manual staffing table keyed to revenue bands:
| Daily Revenue Band | Front Staff | Production Staff |
|---|---|---|
| Under $800 | 1 | 2 |
| $800–$1,500 | 2 | 2 |
| $1,500–$2,500 | 3 | 3 |
| Over $2,500 | 4 | 3–4 |
Set your own bands from your actual data. The point is to make staffing a rule tied to expected demand, not a gut call the night before.
Multi‑site note: run these per location but review them centrally on one sheet. The value at multi‑site is spotting that Site B always over‑bakes on Mondays while Site A runs out — patterns that are completely invisible when each manager only sees their own store.
So Which Do You Buy First?
Start with forecasting if waste is visibly high, you have decent POS data, and ingredient or perishable costs dominate your margins. It pays back faster and picks fewer internal fights.
Start with scheduling if labor runs high as a share of revenue, you've got chronic understaffed mornings or overtime creep, and waste is already under control. Just know it's a slower, stickier change because you're touching people's hours.
And if your POS data is a mess right now, buy neither yet. Spend a month running the two templates above and cleaning your exports. The bakeries that get real returns from either system are almost always the ones that did the boring data work first — the software just made a clean process faster, it didn't rescue a broken one.
And if your POS data is a mess right now, buy neither yet. Spend a month running the two templates above and cleaning your exports. The bakeries that get real returns from either system are almost always the ones that did the boring data work first — the software just made a clean process faster, it didn't rescue a broken one.
Ready to elevate your bakery operations?
Join 2,000+ bakeries using Bakeryly to streamline workflows, reduce waste, and delight more customers.