

Most bakery merchandising experiments fail before they start. Not because the ideas are bad, but because bakery owners treat their display cases like static furniture instead of dynamic sales tools.
The average bakery changes their front-of-house display maybe twice a year—usually during a slow Tuesday when someone finally gets annoyed enough at the cluttered pastry case. Meanwhile, customers make purchase decisions in about three seconds while staring at that same case, and you're leaving money on the table because your most profitable items sit in visual dead zones.
Running merchandising experiments doesn't require a marketing degree or fancy software. What it does require is a systematic approach to testing small changes and actually measuring whether they move product. Stuff you can set up during a lunch break and track with sales data you already have.
Why most display experiments become expensive guesswork
Traditional retail merchandising wisdom says put high-margin items at eye level. Great advice for cereal boxes. Less useful when your customers are leaning over a curved glass case at varying heights, half of them on their phones, and your "eye level" changes depending on whether someone's grabbing a morning croissant or browsing for dessert after 3pm.
The real problem isn't the advice—it's that bakeries implement changes wholesale without any way to measure impact. You move everything around based on a hunch, sales go up or down for any number of reasons, and you never know if the new arrangement helped or hurt.
A bakery in Denver completely reorganized their case based on a consultant's heat map analysis. Cost them somewhere around $3,400. Sales dropped 8% the following month. Turns out regular customers couldn't find their usual items and just stopped buying them. There was no way to isolate what worked versus what didn't because everything changed at once.
Compare that to a small operation in Portland that tested moving just their lemon bars from the bottom shelf to the middle tier next to their bestselling brownies. One change. Lemon bar sales went up 47% over two weeks. Cost of the experiment: zero. Time to implement: maybe 90 seconds.
The three experiments that actually generate data
Three types of experiments consistently produce measurable results without disrupting operations. Each takes under 10 minutes to set up and uses sales data you're already collecting.
Placement rotation testing
The simplest experiment with the highest potential impact. Instead of reorganizing your entire case, you rotate single items through different positions systematically.
Pick one underperforming SKU—something that sells, just not great. Track its daily sales for one week in its current position. Move it to a premium spot (usually center-middle tier) for the next week. Compare the averages.
A neighborhood bakery tested this with their fruit tarts, which averaged 4 sales per day sitting on the bottom shelf. Moved to the middle tier: 11 per day. Moved to the top tier: 6 per day. Middle tier won. Total time invested: swapping position tags twice.
The measurement template is straightforward:
-
Week 1 (baseline position)
-
Monday
units sold
-
Tuesday
units sold
-
[Continue for full week]
-
Weekly average
X units
-
Week 2 (test position)
-
[Same tracking]
-
Weekly average
Y units
Lift percentage = ((Y - X) / X) × 100
If lift is above 20%, the move is probably worth making permanent. Below 10%, not worth the disruption.
Price anchoring with decoy items
Price anchoring works because customers need context to evaluate value. Most bakeries accidentally anchor against their cheapest items by putting budget options front and center.
The experiment: introduce one premium-priced "decoy" item next to your target product. Not necessarily to sell the decoy, but to make your target item look like better value by comparison.
A real example: a bakery sold custom decorated cupcakes for $4.50 each. Decent seller, but margins were tight. They added a "signature" cupcake at $7.50 right next to the regulars—same cake, just a fancier frosting design that took an extra 30 seconds to execute.
The $7.50 cupcakes barely moved, maybe 2–3 per day. But sales of the $4.50 cupcakes jumped 34%. Customers saw $7.50, thought that's too much for a cupcake, then grabbed the $4.50 option feeling like they made the smart call.
Measurement approach:
-
Track target item sales for 5 days pre-decoy
-
Introduce decoy item in adjacent position
-
Track target item sales for 5 days post-decoy
-
Calculate daily average difference
Keep everything else constant—same position, same signage style, just add the anchor.
Bundle signage without actual bundles
Something counterintuitive: you don't need to actually create bundles to benefit from bundle psychology. Just suggesting combinations through signage can boost sales of individual items.
Instead of "Coffee + Muffin = $6" (which adds transaction complexity), try "Perfect with our house coffee" tags on select pastries. Customers still buy items separately, but the suggestion plants the idea.
A small bakery tested this during their afternoon slump, roughly 2–4pm. They added small tent cards saying "Afternoon pick-me-up pairing" next to their cookies, positioned near the coffee station. No actual bundle, no discount, just the suggestion.
Coffee sales between 2–4pm increased 18%. Cookie sales in the same window went up 24%. The operation stayed exactly the same—customers still ordered individually. The only change was three tent cards that took 5 minutes to print and place.
To measure it:
-
Track individual SKU sales during your target daypart for one week
-
Add suggestion signage (not bundle pricing)
-
Track the same SKUs for another week
-
Compare the daypart-specific averages
When you run a merchandising test, only compare the same time slices. Morning coffee cake sales to morning coffee cake sales, not morning versus afternoon.
Building your A/B testing framework without the complexity
Proper A/B testing usually requires controlling for dozens of variables. Bakery operations don't need pharmaceutical-trial levels of rigor. You need directionally correct data that helps you make better decisions.
The daily sales slice method works because it accounts for how wildly bakery sales patterns fluctuate, while keeping measurement manageable. Instead of comparing whole days, you compare specific time blocks.
Morning slice (open to 11am): Best for testing grab-and-go items, coffee pairings, and commuter-focused products. Customer mindset: speed and routine.
Lunch slice (11am to 2pm): Good for sandwich adjacents, savory items, light lunch options. Customer mindset: actual hunger, less browsing.
Afternoon slice (2pm to 5pm): Good for treat positioning, coffee combinations, and impulse purchases. Customer mindset: indulgence and energy.
Evening slice (5pm to close): Ideal for whole cakes, take-home boxes, and next-day orders. Customer mindset: planning ahead, family purchases.
Sample measurement grid:
| Time Slice | Baseline Week | Test Week | Change % | Decision |
|---|---|---|---|---|
| Morning | 23 units | 31 units | +35% | Keep change |
| Lunch | 8 units | 9 units | +13% | Neutral |
| Afternoon | 12 units | 11 units | -8% | Monitor |
| Evening | 4 units | 6 units | +50% | Keep but low volume |
Decision rules:
-
Over 25% lift
make permanent
-
15–25% lift
extend test another week
-
Under 15% lift
revert to original
-
Any decrease
revert immediately
Here's a simple visual of the A/B testing flow.
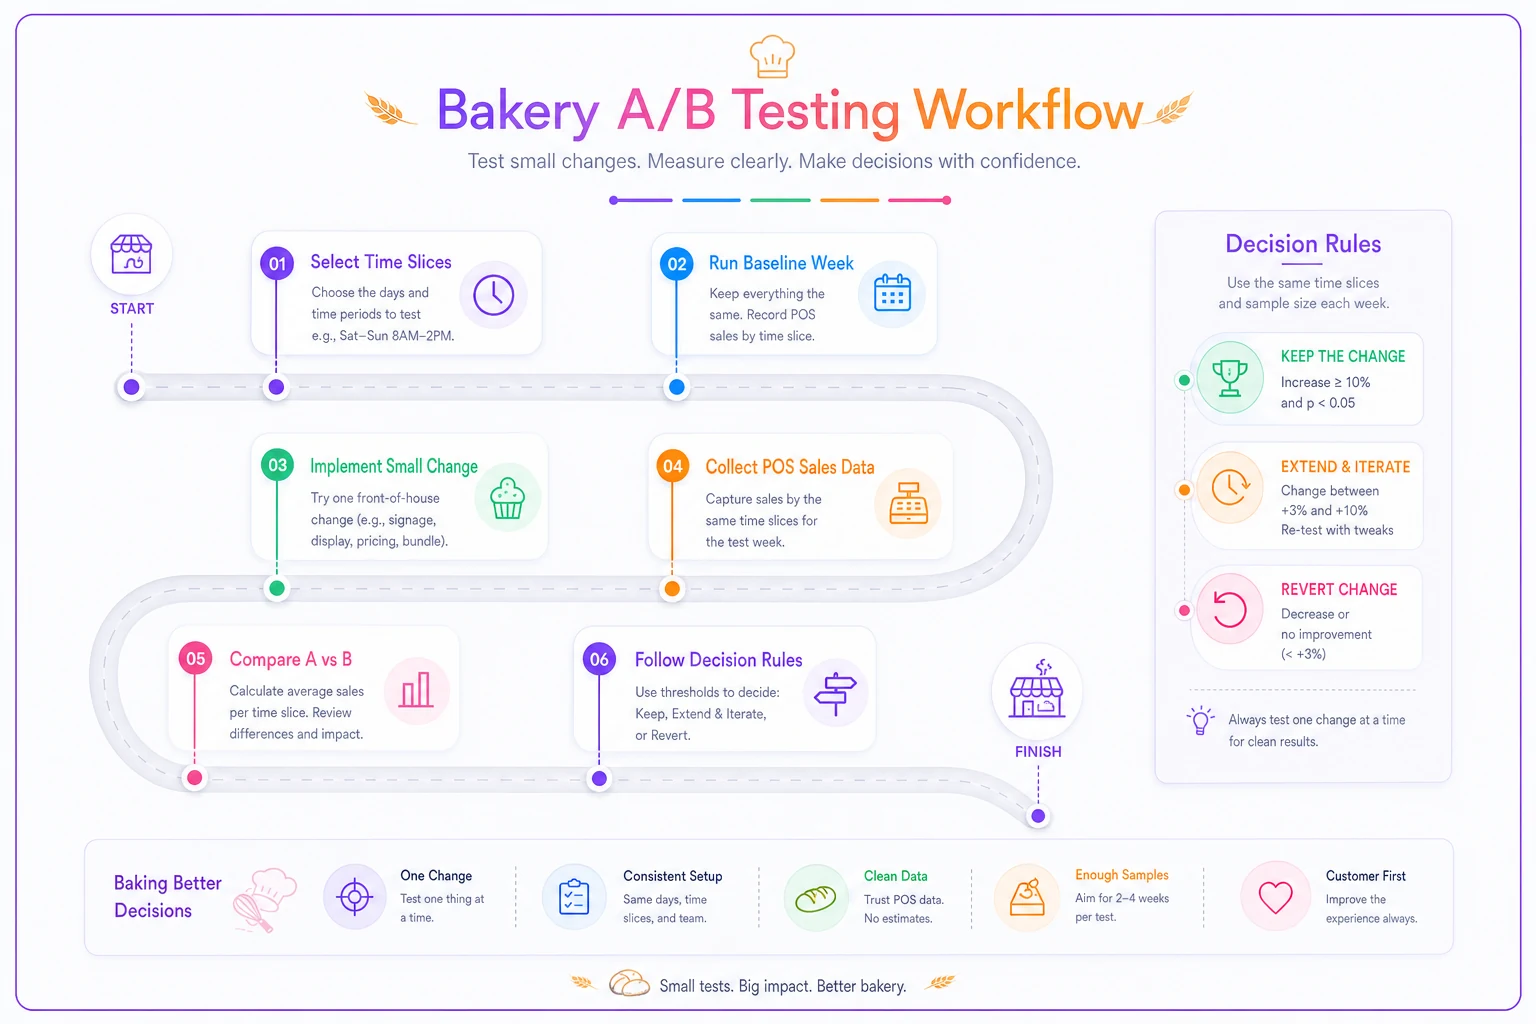
Use the flow to keep your tests consistent.
Statistical significance for people who hate statistics
You don't need to understand p-values to know if a change is working. But you do need enough data to avoid making decisions based on a fluke day.
Minimum sample size rule for bakery merchandising: at least 30 transactions for the specific item before making a call. Not 30 total customers—30 people who actually bought the thing you're testing.
If an item normally sells 5 units per day, you need about 6 days of data. If it sells 15 per day, 2–3 days is enough. This prevents you from declaring victory because sales spiked the one day a tour bus stopped by.
A practical example: a bakery tested moving their $8 quiche slices from the cold case to the hot display. Day 1: sold 12 (versus their usual 7). Owner got excited. Day 2: sold 6. Day 3: 14. Day 4: 8. The variance was all over the place.
But after 8 days and 76 total sales, the pattern became clear—average of 9.5 per day in the hot case versus 7 in the cold case. A 35% improvement, consistent enough to make permanent.
The hidden psychology of bakery cases
Watch customers at a bakery case for 20 minutes and you'll notice patterns that retail theory doesn't really prepare you for. People lean left naturally. They avoid items that look too perfect, which reads as old. They buy more from fuller shelves even when it's the same quantity spread differently.
These quirks matter more than traditional merchandising rules. One bakery found their coconut macaroons sold 40% better when displayed slightly messy versus perfectly lined up. Same product, same position, just loosely arranged versus neat rows. Customers perceived the messy ones as fresh from the kitchen.
Another operation found that raising their case dividers by just 2 inches created visual "rooms" that increased average transaction size by around $2. Customers treated each section like a separate decision instead of one overwhelming wall of choices.
The adjacency effect is particularly strong in bakeries. Complementary items placed next to each other tend to lift sales of both. But the complement isn't always obvious. Cheese danishes next to fruit danishes makes sense. One shop found that putting savory scones next to sweet scones actually decreased sales of both—customers wanted a mental separation between meal and dessert.
When display changes backfire
Not every merchandising experiment works, and some actively hurt sales. The key is catching failures fast.
The most common failure: moving bestsellers to "premium" positions. Seems logical—your best products deserve the best real estate. But regular customers have muscle memory. They walk in, grab their usual from its usual spot, done. Move it and they either can't find it or assume you're out.
One bakery moved their famous cinnamon rolls from their traditional corner spot to front-and-center. Regulars started asking "did you stop making cinnamon rolls?" Sales dropped 30% in three days. Moved them back, sales recovered immediately.
Another trap: optimizing for margin percentage instead of gross profit dollars. Yes, that artisan focaccia has a 70% margin. But if it sells 3 pieces per day at $8 each, it's generating about $16.80 in gross profit. Your 40% margin cookies selling 60 units at $2 each generate $48. Guess which one should get the premium placement.
The "special occasion" positioning mistake shows up constantly. Bakeries put fancy cakes and decorated items in premium spots, thinking visibility drives sales. But special occasion purchases are planned—customers come in specifically for that birthday cake and will find it wherever it is. Meanwhile, impulse items that actually benefit from visibility sit in corners.
Connecting experiments to operations
Merchandising tests mean nothing if they break your workflow. The most successful experiments integrate with existing operations rather than fight against them.
Take refill patterns. If your morning team restocks the case in a specific order, changing display positions can cascade into production delays. One bakery's merchandising test put their fresh-baked muffins in three different case positions. Looked great. Their baker had muscle memory for the old layout and kept putting muffins in the wrong spots, creating confusion and waste.
Your production system needs to align with your merchandising experiments. If you're testing whether brownies sell better on the top shelf, make sure your afternoon production schedule can keep that shelf stocked during peak hours.
Temperature zones matter more than most bakeries realize. Moving items between refrigerated and ambient sections isn't just a merchandising decision—it's a food safety and quality consideration. That cheese danish might sell better in the ambient case, but if it degrades after 2 hours at room temperature, the increased sales won't offset the waste.
When you run menu engineering experiments, the display component often determines success or failure. You can have the perfect new product, priced right, marketed well, but if it's sitting in a dead zone of your case, it'll underperform regardless.
The measurement infrastructure that scales
Paper works for one or two experiments. But once you're running tests regularly, you need a system that doesn't create its own administrative burden.
The simplest functional approach uses your existing POS data plus a basic experiment log. Every test gets recorded with:
-
Start date and time
-
Specific change made
-
Baseline metric
-
Daily results
-
End date
-
Final decision
Most modern POS systems can track item-level sales by time period, but most bakeries never access those reports. Spending 20 minutes learning your system's reporting function pays off immediately—suddenly you can pull hourly sales data for any SKU without manual counting.
For operations using AI-powered platforms to manage ordering and production, connecting merchandising results becomes more straightforward. The system already tracks what sells when. Adding position data creates a feedback loop where successful display strategies can inform production planning—your morning team knows to prep extra lemon bars because the data shows the middle-shelf placement consistently drives significantly higher sales.
Even with manual tracking, the discipline of measurement beats flying blind. A simple Google Sheet with daily entries beats the most sophisticated system that nobody actually uses.
Making decisions when data conflicts
Sometimes experiments give you conflicting signals. The brownies sell better on the top shelf but that's also where your highest-margin items should go. The new position increases units but decreases dollars because people grab fewer add-ons. What do you optimize for?
A working hierarchy:
-
Gross profit dollars per day (not percentage)
-
Inventory turnover (especially for perishables)
-
Customer flow and speed of service
-
Operational complexity
-
Everything else
A real scenario: a bakery tested moving their pre-packaged cookie sets from behind the counter to a self-serve display near the register. Unit sales increased 60%. Clear win, right?
The full picture was messier. Gross profit only increased 20% because people bought the pre-packs instead of custom boxes with higher margins. Transaction time increased by around 45 seconds average because customers browsed while checking out. And theft went up enough to matter.
They kept the display but moved it away from the register, accepting slightly lower sales for better flow and reduced shrinkage. The experiment wasn't a failure—it revealed the tradeoffs and let them optimize accordingly.
Beyond the case: expanding the test zone
Front-of-house experiments don't stop at the display case. Every customer touchpoint is a testable opportunity.
Queue merchandising gets ignored by most bakeries. Customers standing in line are a captive audience with time to kill. Testing different arrangements of impulse items along the queue path follows the same framework. One shop found that moving their packaged cookies from the counter to a basket at the queue midpoint increased sales by 85%. People grabbed them while waiting instead of making a decision under pressure at the register.
Signage placement experiments reveal surprising patterns. Menu boards above the case seem logical, but testing showed customers make better decisions with menus at counter height where they can read while looking at actual products. One bakery increased average transaction size by over a dollar just by moving their menu from above to beside the case.
The wall behind the register is also underused. Customers stare at it while transactions process. Testing different displays there—upcoming specials, catering menus, even just appetizing photos—can plant seeds for future purchases without any operational change.
The compound effect of small wins
Individual merchandising experiments can seem minor in isolation. Moving muffins up one shelf. Adding a small sign. Adjusting a price by 50 cents. But these micro-optimizations compound into real results over time.
Rough math: if placement tests increase sales of just 3 items by 20% each, and those items average $4 with a 60% gross margin, that's somewhere around $2,600 in additional annual gross profit per item. Multiply that across your full product range and merchandising experiments start driving meaningful profit without adding cost.
More importantly, regular testing builds organizational learning. Your team starts noticing what works. They spot opportunities you'd miss. They understand why certain decisions get made. The experimental mindset becomes part of how the operation runs, not a special project you revisit once a year.
The bakeries that consistently grow aren't always the ones with the best products or locations. They're the ones that treat their operation as a living system—constantly testing, measuring, and adjusting. Every small improvement stacks on the last one. Competitive advantages that look like magic to outsiders are usually just disciplined experimentation done consistently over time.
Your display case is either a passive container or an active sales tool. That choice has a real profit difference attached to it.