
Most bakery owners think their bestsellers are their moneymakers. They're usually wrong. That chocolate croissant flying off the shelves? After factoring in the Valrhona chocolate, the three-fold lamination time, and the shelf space it occupies, it might be generating less profit per square foot than the simple sourdough loaf sitting next to it. The real problem isn't identifying what sells—it's understanding what should stay on your menu versus what needs to go. Building a bakery menu engineering system isn't about gut feelings or copying what the shop down the street does. It's about creating a repeatable process that tells you exactly when to kill a product, when to double down, and when you need more data before making the call.
Why traditional menu analysis fails in bakeries
Restaurant menu engineering doesn't really translate to bakeries. A restaurant can test a new dish tonight and get feedback from 30 covers. A bakery launching a new pastry might sell 8 units on Tuesday, 12 on Wednesday, then 40 on Saturday. Is that product successful? Depends who you ask and on which day.
Seasonality makes it worse. Your summer fruit tart that barely breaks even in March might have killer margins come June when local strawberries drop to $2 a pound. Cut it in March based on winter performance and you miss the profitable season entirely.
Then there's production complexity. Bakeries commit to production runs at 3am based on yesterday's guess about today's demand. When you're wrong, you eat the loss—literally and financially.
Traditional analysis also misses interdependencies. That mediocre-margin dinner roll might be the reason families buy three sandwiches at lunch. Cut the rolls, lose the sandwich sales. These relationship patterns only become clear when you track the right metrics over a long enough timeframe.
The three numbers that actually matter
Forget food cost percentage for a minute. The trinity of bakery menu engineering comes down to COGS per unit, velocity, and contribution margin. Everything else is just these three in different costumes.
Never miss a bake or delivery again.
Bakeryly helps you schedule, track, and manage every order effortlessly.
- Unified order tracking
- Real-time inventory alerts
- Staff shift management
No credit card required
COGS per unit includes more than ingredients. Add labor time (at your actual labor rate), packaging, the sticker on top, and the paper bag it goes in. That $0.80 in ingredients becomes $2.40 in true cost once you factor in 8 minutes of skilled decorating time.
Velocity isn't just units sold—it's units sold per production slot per day. A product that sells 20 units from a single morning batch beats one that sells 25 units but requires three separate bake times. Velocity tells you what's worth the oven space.
Contribution margin shows what's left after COGS to cover overhead. Not profit—contribution. A product with a $3 contribution margin selling 100 units weekly puts $300 toward your rent. One with a $5 margin selling 40 units only contributes $200. Volume matters as much as margin.
Track these three metrics for every SKU, every week. Not monthly averages—weekly actuals. Patterns hide in averages. A product that looks stable monthly might swing wildly week to week, pointing to production issues or demand you're not capturing.
Building your experiment framework
You can't test everything at once. Start with your bottom 20% performers by contribution margin. These are your experiment candidates.
Each experiment needs a clear hypothesis—not "let's see if this sells better," but "if we reduce the size 20% and drop the price 15%, velocity should increase 30% while maintaining margin." Specific predictions force clarity about what you're actually testing.
The framework:
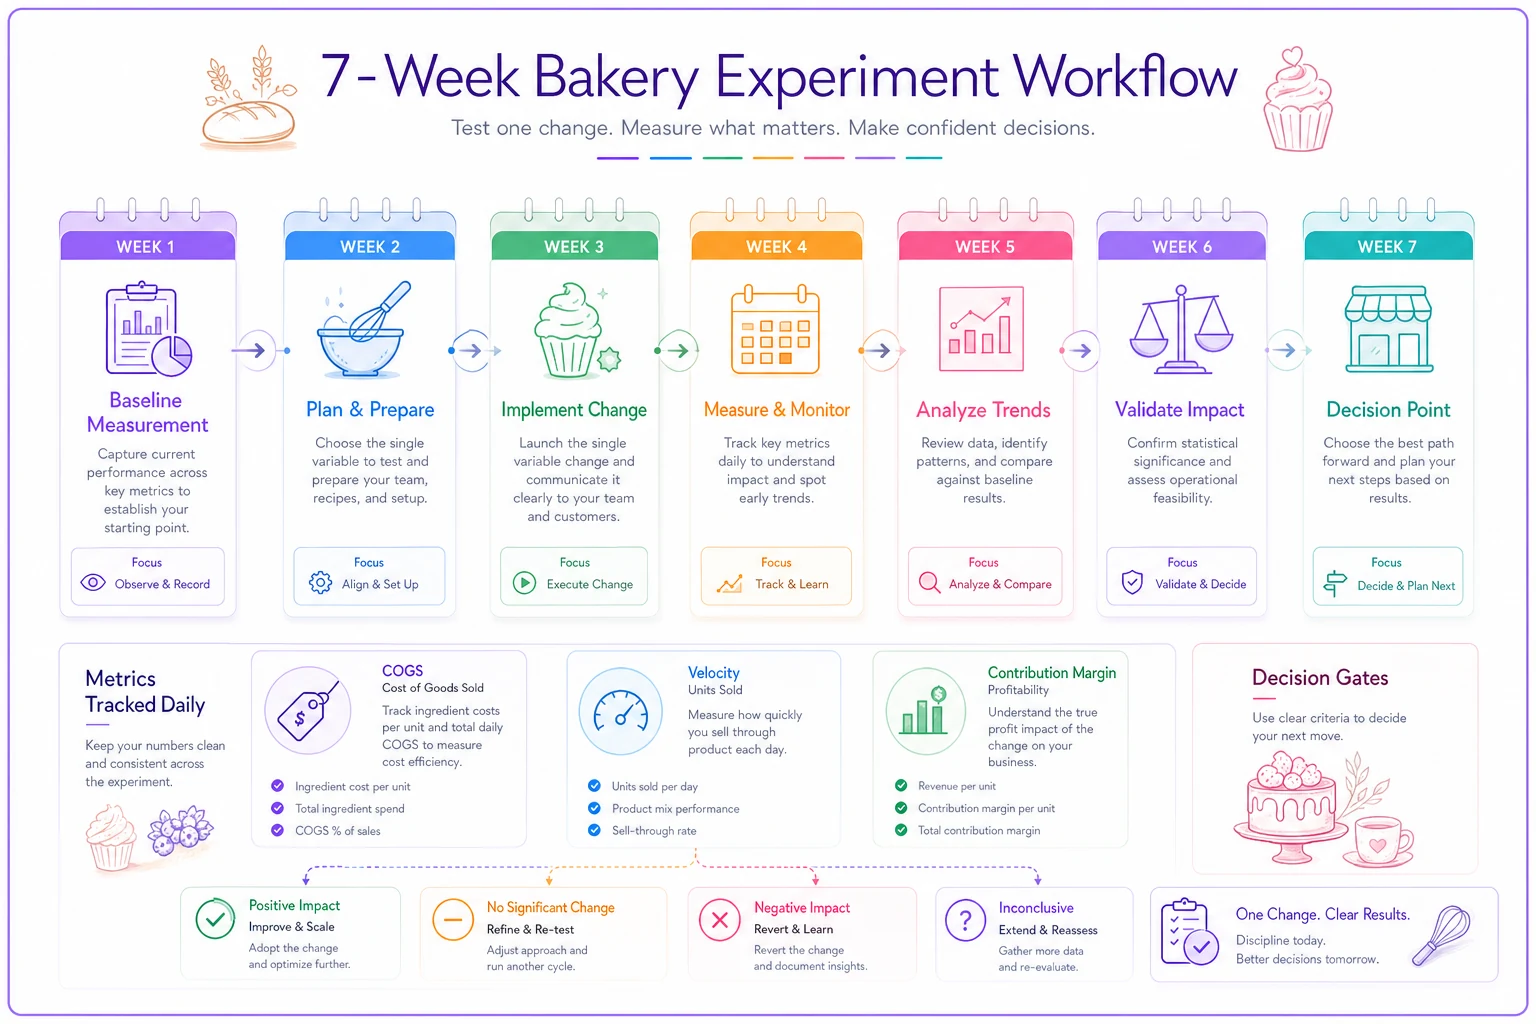
Week 1-2: Baseline measurement Capture current performance without changes. This is your control data.
Week 3-4: Single variable change Price, size, placement, or description—pick one. Change only that variable.
Week 5-6: Measurement period Track the same metrics. Did they move in the predicted direction?
Week 7: Decision point Continue, revert, or try another change. No extending "just to see"—that's how experiments become permanent mediocrity.
Document everything in a simple spreadsheet. Date, product, change made, prediction, actual result, decision. After six months, patterns emerge about what types of changes actually work in your specific market.
Minimum sample sizes and statistical confidence
This is where bakery owners usually go wrong: making decisions on insufficient data.
| Product type | Minimum sample size |
|---|---|
| Daily items | 30 consecutive days |
| Weekend items | 12 weekends (Friday-Sunday counts as one data point) |
| Seasonal items | Two full seasons (yes, this means waiting a year) |
You need at least 30 data points to make a statistically meaningful decision about a product. For a daily seller, that's a month. For a weekend-only special, that's four months. It frustrates owners who want quick answers, but moving too fast on thin data costs more than waiting.
For products with erratic sales patterns, extend the sample period—artisan items with weekend spikes often need eight weeks to stabilize.
But statistical significance isn't everything. Business significance matters too. A product showing 15% improvement on 500 weekly units beats one showing 40% improvement on 20 units. Weight your attention by total contribution, not percentage change.
For products with erratic sales patterns, extend the sample period. That artisan fruit bread selling 2 on Monday, 1 on Tuesday, then 15 on Saturday needs eight weeks minimum to establish a real pattern.
Decision rules that remove emotion
The hardest part isn't measuring—it's killing products you love but customers don't. That's why you need decision rules defined before you start testing.
A basic decision matrix:
Immediate elimination:
-
Contribution margin below $1.50 per unit
-
Velocity below 10 units per week
-
More than 3 customer complaints per month
Probation period (one improvement attempt):
-
Contribution margin $1.50-$2.50
-
Velocity 10-25 units per week
-
Requires specialty ingredients with 7+ day lead time
Protection status (keep regardless of numbers):
-
Loss leader that drives traffic (track door swings on days with/without)
-
Gateway product for first-time customers
-
Required for catering contracts
Investment candidates (increase production):
-
Contribution margin above $3.50
-
Velocity above 40 units per week
-
Less than 5 minutes production time per unit
The rules eliminate debate. Product meets elimination criteria? Gone next month. In the probation zone? One chance to improve, then reassess. This isn't cruel—it's clarity.
Seasonal adjustment strategies
Bakery demand swings predictably and unpredictably. Your system needs to handle both.
Build seasonality coefficients for each product category. Track the same items year-over-year:
-
January performance vs. annual average
-
February vs. average
-
And so on...
After two years, patterns show up. Cookies might index at 140% in December, 70% in July. Bread stays steady year-round. Fresh fruit pastries swing from 40% in winter to 180% in summer.
Use these coefficients to adjust your decision thresholds seasonally. A fruit tart pulling 15 units weekly in February (40% season) projects to roughly 37 units in June (180% season). That changes whether you cut it or keep it.
Plan seasonal transitions actively:
-
6 weeks before peak season
Test recipes, train staff, order specialty ingredients
-
4 weeks before
Soft launch to regular customers
-
2 weeks before
Full marketing push
-
Peak season
Maximize production
-
2 weeks after peak
Start scaling down
-
4 weeks after
Evaluate for off-season retention or hibernation
The hibernation concept matters more than people realize. Some products shouldn't run year-round but also shouldn't disappear completely. Keep the recipe, training, and supplier relationships active with monthly limited runs. When the season returns, you scale immediately instead of starting from scratch.
The experimental cadence that works
Running experiments randomly burns out your team and confuses customers. You need a rhythm.
The quarterly cycle works best:
-
Month 1
Measure and analyze No changes. Just track metrics and identify underperformers.
-
Month 2
Test and adjust Run experiments. Maximum three products at once—more than that and you can't isolate variables.
-
Month 3
Implement and stabilize Make your cuts, scale your winners, train on any new products.
This gives customers predictability while giving you flexibility. The menu evolves quarterly but isn't constantly churning.
Within the testing month, stagger your experiments:
-
Week 1-2
Price adjustments (easiest to implement)
-
Week 2-3
Size or recipe modifications
-
Week 3-4
New product trials
Never test competing products simultaneously. If you're experimenting with your chocolate croissant, don't also test the pain au chocolat. Customer choice between them is part of what you're measuring.
Connecting menu decisions to production planning
Your menu engineering system has to integrate with production planning. A product might look profitable on paper but wreck your morning workflow.
Consider production compatibility when evaluating products:
-
Does it bake at the same temperature as other items?
-
Can it share prep steps with existing products?
-
Does it require equipment that sits idle otherwise?
That specialty brioche might show decent margins, but if it needs the mixer for 45 minutes during your busiest prep window, the opportunity cost kills its true profitability.
Build production burden into your COGS calculation. A product requiring dedicated oven time costs more than one that shares a rack. A pastry needing single-layer sheet pans uses more resources than one you can stack. These invisible costs add up fast.
Map each product to its production touchpoints:
-
Mixing (which mixer, how long)
-
Proofing (space required, temperature needs)
-
Baking (temperature, time, special requirements)
-
Finishing (decoration time, cooling needs)
-
Packaging (special materials, labor time)
Products that complicate multiple touchpoints need higher margins to justify their existence.
Scaling winners without operational chaos
When a product tests well, the instinct is to immediately triple production. This usually backfires.
Scale in 25% increments. If you're selling 40 units and tests suggest you could sell 100, go to 50 first. Then 65. Then 80. Each increment surfaces new bottlenecks—mixer capacity, proofing space, decorator availability, packaging supplies.
Recipe scaling introduces its own headaches. A buttercream that works in 5-pound batches might break at 15 pounds. Laminated dough that's perfect in 20-unit runs might get tough at 60. Test scaled recipes during slow periods before committing to increased production.
Document scaling thresholds for each product:
-
Maximum single batch size
-
Minimum batch for efficiency
-
Sweet spot for quality/efficiency balance
Some products don't scale linearly. That handmade danish taking 5 minutes per unit at 20 units might creep up to 7 minutes per unit at 40 units due to decorator fatigue. Build that reality into your projections.
Reading customer response beyond sales data
Sales numbers tell you what happened, not why. Your experiment system needs qualitative feedback loops too.
Train front-of-house staff to capture specific feedback:
-
"Looks dry" (appearance issue)
-
"Too sweet for breakfast" (positioning problem)
-
"Is this gluten-free?" (opportunity signal)
-
"You were out yesterday" (underproduction)
A simple tally sheet by the register works fine—not a complex form, just hash marks next to common feedback categories. Review weekly alongside your quantitative metrics.
Watch purchase patterns, not just individual sales:
-
What combinations do people buy together?
-
What do they ask for that you don't have?
-
What do they pick up and put back?
That last one is worth paying attention to. Products getting picked up and returned have appeal but something's off—usually price or size. These are prime experiment candidates.
Social media mentions matter but weight them appropriately. One Instagram post doesn't equal 20 sales, but consistent unprompted mentions suggest broader appeal. Screenshot and date everything for quarterly reviews.
When to break your own rules
Sometimes the data-driven system needs overriding. Knowing when is the difference between rigid adherence and smart operations.
Break the rules for:
-
New customer acquisition strategies
-
Community relationship building
-
Testing completely new categories
-
Responding to competitive pressure
Keep a "strategic override" budget—roughly 10% of menu slots for products that don't meet metrics but serve other purposes. That barely-profitable vegan donut might be worth keeping if it brings in a customer segment that also buys high-margin coffee drinks.
Document why you're breaking the rule and set a review date. "We're keeping the gluten-free muffins despite low margins because they drive catering orders—reassess in six months." Without documentation, exceptions quietly become permanent drags on profitability.
The technology layer that makes this manageable
Tracking all this manually works for about two weeks before something slips. The breakfast rush hits, someone forgets to mark inventory, and suddenly your data has gaps that make the whole analysis unreliable.
This is where operational software makes a real difference. Instead of spreadsheets scattered across different computers, a centralized system connects sales, inventory, and production data automatically. AI-powered platforms can track your true COGS in real-time by pulling from your POS, inventory system, and production logs simultaneously—so when flour prices spike, your contribution margins update immediately across every product using that ingredient. No manually recalculating 40 different items.
The experimental framework benefits from this too. Software can track your test periods, flag when you have sufficient sample size, and calculate whether changes were actually meaningful. It removes the mental overhead of remembering where you are in three simultaneous experiments.
These platforms also handle the communication layer. When you cut a product, the system can automatically update your website, notify wholesale customers, and adjust next week's ingredient orders. When you scale a winner, it updates production schedules and par levels across all channels—things that otherwise require someone to manually touch five different systems.
Making menu engineering sustainable
The biggest failure point in menu engineering isn't the system—it's maintaining momentum after the initial push.
Start with quarterly reviews, not monthly. Monthly feels like constant change to customers and wears out your team. Quarterly gives enough data for meaningful decisions while maintaining stability.
Assign a single owner to the menu engineering system. Not a committee—one person who runs the experiments, collects the data, and presents recommendations. Others can weigh in on decisions, but someone needs to own the process or it quietly dies.
Keep the system visible. Post your experiments where staff can see them. Share results, including failures. When the team understands why an underperforming product got cut, they stop taking it personally and start thinking systematically about the menu.
Build institutional knowledge. Every experiment teaches something. Document not just what you tried, but why you thought it would work and why it didn't. After a year, you'll have a real playbook of what resonates in your specific market.
The compound effect of systematic improvement
A bakery implementing this menu engineering system typically sees something interesting happen around month six. The improvements start compounding.
Early wins are obvious—cutting the dogs, scaling the stars. But as you accumulate experimental knowledge, your new product success rate improves. Instead of launching five items hoping one works, you launch two with real confidence based on patterns you've identified.
Production gets smoother too. Fewer SKUs but better performers means your morning prep becomes more predictable. Waste drops. Your team gets faster at producing what actually sells instead of spreading effort across marginal products.
Customer satisfaction paradoxically increases with fewer choices. A focused menu of proven winners beats a scattered one where half the items disappoint. Regulars learn they can trust your recommendations because you've cut anything not worth eating.
Most importantly, your financial picture clarifies. Instead of wondering why busy Saturdays don't translate to better margins, you know exactly which products drive profit and which create motion without money. This isn't about turning your bakery into a soulless optimization machine. When you know what works, you can take bigger swings on truly innovative products because you have a safety net of proven performers. The system creates freedom, not constraints.
Ready to elevate your bakery operations?
Join 2,000+ bakeries using Bakeryly to streamline workflows, reduce waste, and delight more customers.