
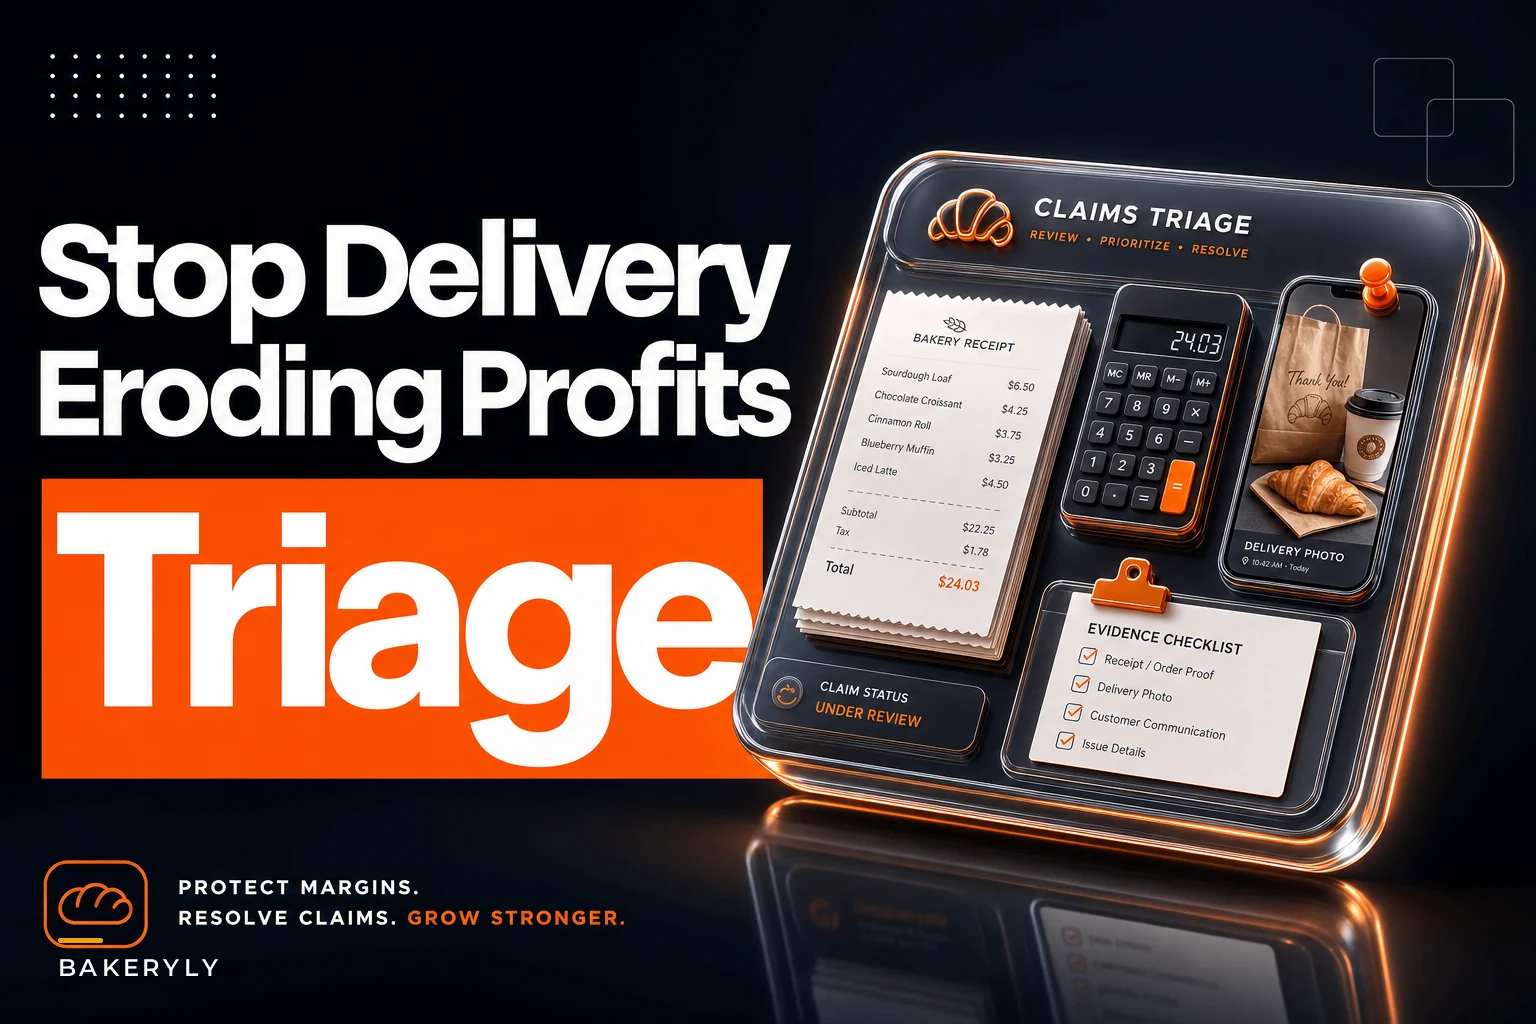

Most bakeries handle delivery damage emotionally. A customer sends a photo of a crushed croissant box, somebody in the front office feels bad, and a free replacement goes out the door. No cost recorded, no cause logged, no pattern tracked. Multiply that by three or four a week and you've got a leak nobody's measuring because it never shows up as a single, scary number.
Delivery damage isn't really a customer-service problem. It's an accounting problem wearing a customer-service costume. And once you treat bakery delivery claims control as a financial function — with cost-capture templates, evidence rules, and a monthly review — the whole thing stops being a guessing game.
This post is narrow on purpose. We're not covering packaging design or driver handoffs here (those are their own beasts). We're talking specifically about what happens after a delivery goes wrong: how to capture the real cost, decide the remedy fast, and use the data to catch systemic failures before they quietly bury your margin.
Why delivery claims quietly wreck your numbers
Delivery damage erodes profit so effectively because it hides in three different places at once, and no single report ever shows the full picture.
First, the product cost disappears into your general waste or COGS figure. A squashed six-pack of macarons that cost you maybe $4.20 in ingredients and labor just vanishes into "shrinkage" with no delivery tag on it.
Second, the replacement cost doubles the hit. You remake the order, you pay to redeliver it, and now you've spent roughly 2x the original fulfillment cost to make one customer whole — but your books show it as two separate, unrelated transactions.
Third, the refund or goodwill credit gets handed out verbally or over DM, often with zero paper trail. Nobody reconciles it against anything.
So the real cost of one damaged delivery isn't the $6 cupcake box the customer complained about. In practice it usually looks more like: original product cost + remake labor + second delivery fee + occasional refund. That single $22 order can easily cost you $35–$45 to resolve. And because those costs are scattered across different line items, you never feel the full weight of it until you actually sit down and add it up — which almost nobody does.
That's the whole game. The fix isn't fewer claims (though you'll get those too). The fix is seeing the claims clearly enough to act on them.
Start with a cost-capture template that forces one number
If you take one thing from this post, make it this: every delivery claim needs a single row in a single sheet, and that row needs to end in one dollar figure — the total resolution cost.
Below are the minimum fields that actually matter. Anything more and your staff won't fill it out consistently; anything less and you can't spot patterns.
| Field | Why it's there | Example |
|---|---|---|
| Date & order # | Ties to POS/invoice | 11/14 — #4821 |
| Channel | Own delivery vs 3rd-party vs courier | DoorDash |
| Route / driver | Spot bad links | AM-North |
| SKU damaged | Spot fragile products | 6pk éclairs |
| Damage type | Spot cause | Crushed in transit |
| Product cost | Real COGS, not retail | $5.10 |
| Remake labor | Rough minutes × rate | $3.50 |
| Re-delivery cost | Fee or driver time | $6.00 |
| Refund/credit | Any cash given back | $0 |
| Total resolution cost | The number that matters | $14.60 |
| Evidence attached? | Y/N | Y |
Notice "retail price" isn't on there. Logging claims at menu price inflates the pain and makes the data useless for real decisions. You want cost, because cost is what actually leaves your bank account.
The "evidence attached" column does double duty — more on that below — but it also tells you at a glance how much of your claim volume is even verifiable.
Evidence requirements: decide before the claim, not during
The worst time to decide whether you believe a customer is in the middle of a complaint. You'll cave, because the customer is upset and you're busy. The rule has to exist beforehand.
-
Under ~$15 resolution cost photo optional, approve on staff judgment, log it anyway.
-
$15–$40
photo of damage required before remedy.
-
Over ~$40 (big catering boxes, multi-item orders) photo plus timestamp or delivery-confirmation reference required.
Tie evidence to dollar value for pure efficiency. Chasing a photo for a $3 cookie wastes more labor than the cookie costs. But waving through a $60 corporate platter on someone's word is how fraud and sloppy drivers both get a free pass.
One pattern worth watching: a small number of accounts that always claim damage but never send photos. You won't catch it person-by-person. You'll only see it when the "evidence attached: N" column stacks up against the same customer name over a couple of months. That's not a customer-service insight — that's an audit finding.
Quick math to decide the remedy on the spot
Staff freeze on claims because they don't know what they're allowed to give. So they either over-give (free everything, apology discount on the next order too) or stall and escalate, which annoys the customer more. A simple decision rule removes both failure modes.
-
Calculate resolution cost two ways remake-and-redeliver vs. refund.
-
If refund ≤ remake-and-redeliver cost, refund. A $5 refund beats a $14 remake every time the customer isn't desperate for the actual product.
-
If the product is time-sensitive (birthday, event, corporate order), skip the math and remake — the relationship is worth more than the delta.
-
If total resolution cost exceeds ~2x the order's gross profit, flag it for a manager instead of auto-approving.
That last rule is the quiet protector. Most individual claims are cheap to absorb. The ones that hurt are the oversized ones that staff approve on autopilot because "we always just remake it." Forcing a flag when costs run past 2x the order's profit catches those before they become routine.
This kind of micro-decisioning is the same discipline that protects you on bigger orders — the catering deposit and risk-matrix logic in the catering workflow playbook is really the same instinct applied upstream: decide the rules before money is on the line.
A real scenario: the route nobody suspected
A mid-size bakery doing both café and local delivery was running somewhere between 180 and 220 delivery orders a month across their own drivers and two third-party apps. Claims felt "normal" — a handful a week, each resolved quickly, nobody sweating it.
When they finally logged everything into a single cost-capture sheet for eight weeks, the total came to around $1,900 in resolution costs. Annualized, that's north of $11k — roughly the margin on a small corporate account they'd been chasing for months.
The useful part wasn't the total. It was the breakdown. Nearly 60% of the dollar damage traced to one third-party courier on afternoon runs, and almost all of it was crushed boxes on stacked multi-item orders. It wasn't random bad luck spread across the business. It was one channel, one time window, one failure type.
They made two changes: switched that courier's afternoon orders to their own driver, and added a rigid box for multi-item afternoon deliveries. Over the next couple of months, delivery claims dropped sharply — a noticeable, obvious improvement — and monthly resolution costs settled into the low hundreds instead of several thousand annualized. No new software, no heroics. Just data finally pointing at the actual problem.
The monthly KPI review that catches systemic failures
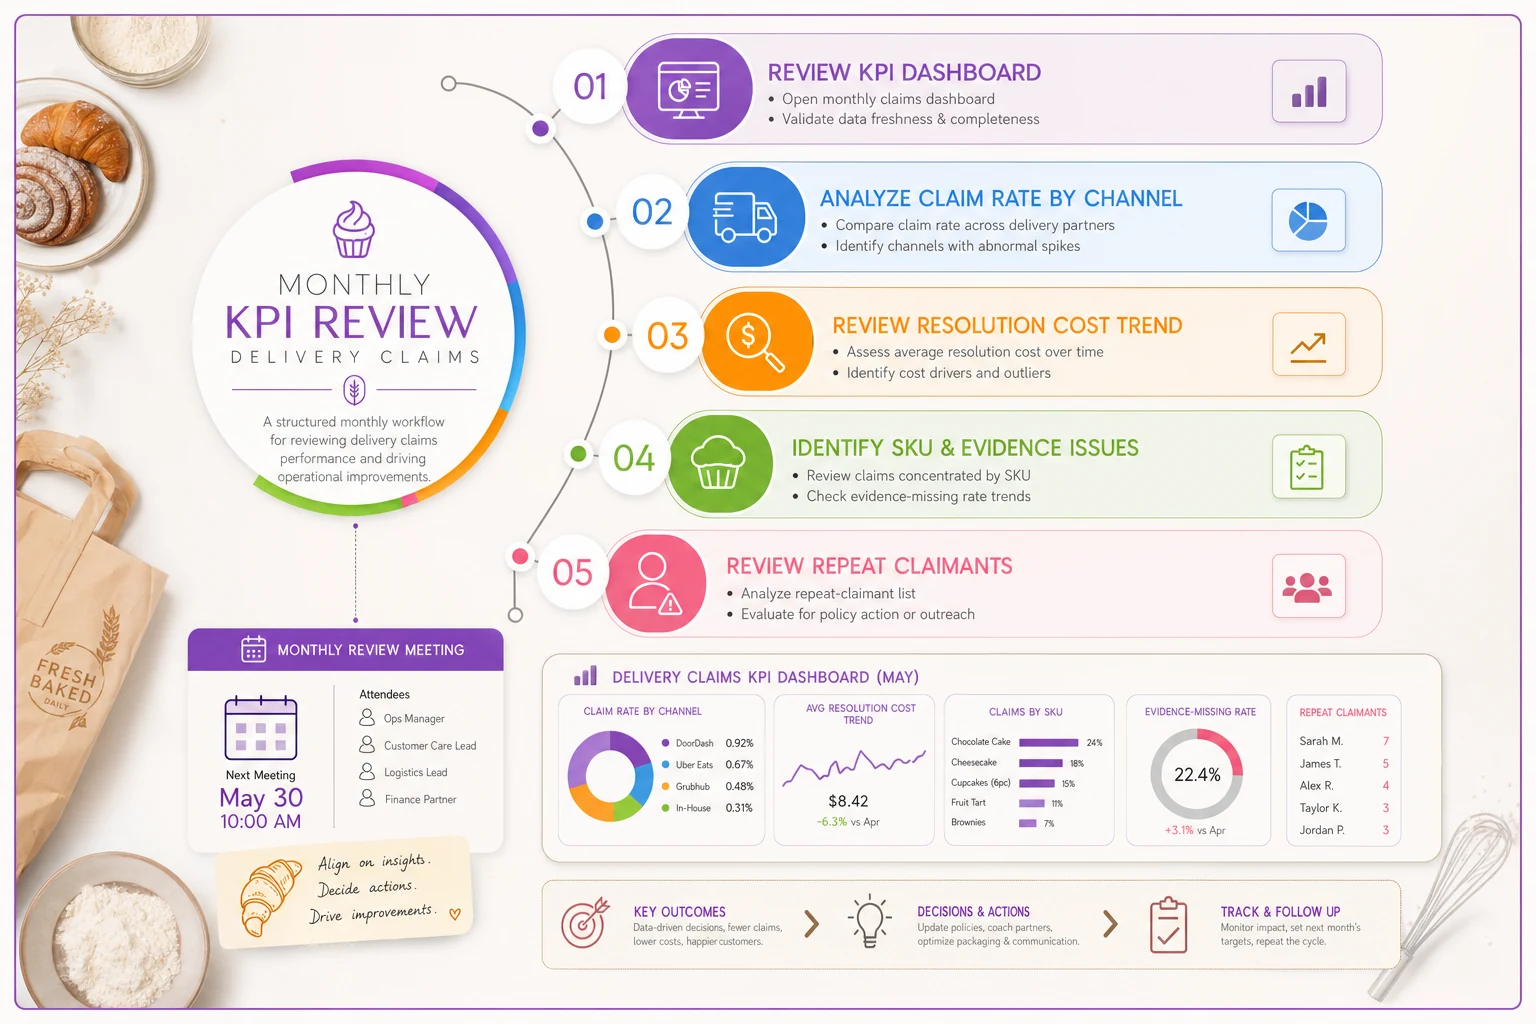
One-off claims are noise. Systemic failures are signal. The only way to tell them apart is a short monthly review — 20 minutes, same day every month — looking at ratios, not raw counts.
A simple trend view keeps the review focused and prevents the meeting from turning into a gripe session.
-
Claim rate by channel (claims ÷ deliveries, per channel). A channel running 3–4x the others isn't unlucky, it's broken.
-
Average resolution cost per claim. If this is creeping up, your remedies are getting too generous or your damage is getting worse.
-
Claims concentrated by SKU. One or two products generating most of the dollar damage usually means a packaging or fragility problem on specific items, not a delivery problem at all.
-
Evidence-missing rate. Rising means your approval discipline is slipping.
-
Repeat-claimant list. Same accounts, same months — flag for review.
The mistake most bakeries make with KPIs is tracking total claim count and feeling good when it drops. Count is misleading — ten $4 cookie claims matter far less than two $60 catering claims. Always weight by resolution cost, not frequency. The expensive failures are usually rare, which is exactly why they hide.
This reconciliation habit pairs naturally with the cash-side discipline covered in the POS reconciliation and shrinkage controls guide — same principle, different leak. Money that walks out through unlogged credits and money that walks out through unlogged damage both disappear the same way: no row, no number, no review.
Where a simple system beats a complicated one
You don't need a claims platform with a ticketing engine to run this. A shared spreadsheet with the fields above, filled out at the moment of resolution, will get you 90% of the value. The whole point is capture-at-the-moment — cost data is only accurate when it's logged while the details are still fresh.
The piece that tends to break down manually is consistency. One staffer logs everything, another forgets, and three weeks later your data has holes right where the interesting patterns would've been. This is where lightweight operational software earns its keep — a simple intake form that forces the required fields, auto-calculates the total resolution cost, tags the channel and route, and builds the monthly summary so the review takes minutes instead of an afternoon of spreadsheet surgery. The value isn't automation for its own sake; it's that the data gets captured the same way every time, by every person, without anyone having to remember to.
But start with the spreadsheet. Prove the pattern first. If you can't fill in ten rows by hand consistently for a month, no software will fix the underlying discipline problem.
When this is overkill
If you're doing a handful of deliveries a week and claims are genuinely rare, a full KPI review is more structure than you need — just keep a running note of resolution costs and glance at it quarterly. This system pays off once delivery is a real channel: dozens of orders a week, multiple routes or couriers, and claims frequent enough that you've stopped noticing each one individually. That's exactly the point at which costs go invisible, which is exactly when you need them visible.
Bringing it together
Delivery damage doesn't erode profit because it's expensive per incident. It erodes profit because it's untracked per incident — product cost, remake cost, and refunds all scattered across different reports where no one ever sums them. The move isn't to stop every claim. It's to capture each one as a single number, decide the remedy with simple math instead of emotion, require evidence proportional to the dollar value, and spend twenty minutes a month looking for the one channel, route, or SKU that's quietly responsible for most of the damage.
Do that, and the vague "we lose some stuff on delivery" feeling turns into a short list of fixable problems — usually a specific courier, a specific time window, or a specific fragile product. Those are problems you can actually solve. The leak you can't see is the only one that keeps costing you.
Do that, and the vague "we lose some stuff on delivery" feeling turns into a short list of fixable problems — usually a specific courier, a specific time window, or a specific fragile product. Those are problems you can actually solve. The leak you can't see is the only one that keeps costing you.