

Most bakeries have more data than they know what to do with. POS exports, waste logs, labor reports, a spreadsheet of custom orders, maybe a loyalty dashboard. And most of that data just... sits there. Somebody glances at last week's numbers, says "sales were a little soft on Tuesday," and then everyone goes back to prepping croissants.
The gap isn't a data problem. It's a loop problem. There's no mechanism that takes a metric moving in the wrong direction and turns it into a real, scoped experiment with a decision rule at the end. So the same problems recur every quarter, and the same "we should try something" conversations die in the parking lot.
This piece is about building that mechanism. Not more reporting—a governance loop that maps specific metric alerts to prioritized experiments, runs them under a light set of rules, and closes the loop by feeding results back into how you operate. The phrase I'll keep coming back to is bakery analytics to experiments, because the whole point is to make the distance between "we noticed something" and "we tested a fix" as short as it can reasonably be.
Why weekly reports rarely change anything
Walk into almost any bakery that's been open more than two years and you'll find a reporting habit that looks productive but produces nothing. Someone prints or opens the weekly summary, there's a quick scan of top sellers and total sales, maybe waste gets mentioned. And then the meeting ends.
The reason this happens is structural, not lazy. A weekly report is a description. It tells you what happened. It doesn't tell you what to do, who should do it, or how you'd know whether the thing you did worked. Between the report and the action there's a vacuum—and vacuums get filled by whoever has the strongest opinion that day.
What shows up repeatedly across small food businesses is that reports without a downstream process create three predictable failures:
-
Observation without ownership. "Almond croissant sales dropped" gets said out loud, but nobody is assigned to figure out why or test a response.
-
Action without measurement. Someone changes the display, or drops the price, but there's no baseline and no end date, so nobody can tell if it helped.
-
Success without memory. Occasionally a change works, but it's never documented, so six months later the same problem reappears and gets "solved" again from scratch.
If you've already built a habit of turning POS reports into weekly decisions, you're halfway there. The pipeline gets you clean, trustworthy numbers on a cadence. This article is the layer on top: what happens after the number lands.
The loop, in plain terms
A closed-loop system has four moving parts, and each one hands off to the next. If any handoff is missing, the loop breaks and you're back to descriptive reporting.
Never miss a bake or delivery again.
Bakeryly helps you schedule, track, and manage every order effortlessly.
- Unified order tracking
- Real-time inventory alerts
- Staff shift management
No credit card required
-
Signal. A metric crosses a threshold you defined in advance. Not "sales are down"—something specific, like "weekend croissant waste exceeded 12% for two consecutive weeks."
-
Prioritization. You have more signals than capacity, so you rank them. Which signal, if fixed, moves the most money or removes the most operational pain?
-
Experiment. The top-ranked signal becomes a scoped test with a hypothesis, a change, a measurement window, and a decision rule.
-
Governance & closure. Someone owns the call at the end. Keep it, kill it, or scale it—and write down what you learned so the loop remembers.
A simple diagram helps visualize how each part hands off to the next.
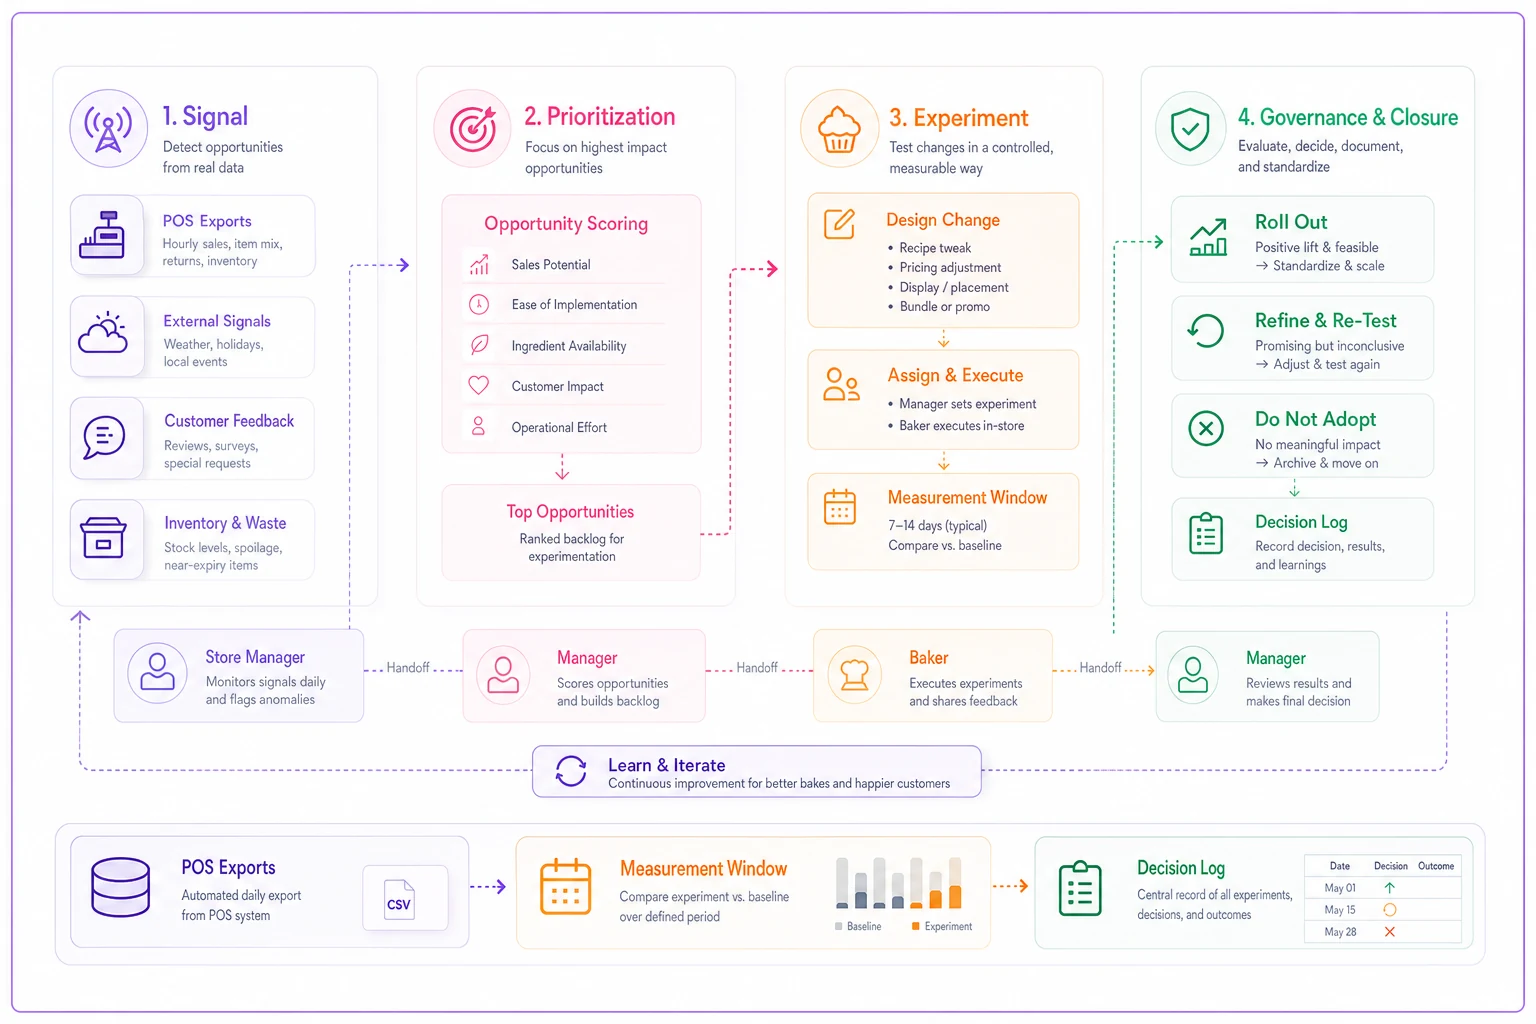
The magic isn't in any single step. It's in the fact that a signal cannot die quietly anymore. Once a metric trips a threshold, the process forces it forward until a human makes a documented decision. That's the whole game.
Step 1: Define signals that actually mean something
Most bakeries track too many metrics and set thresholds on none of them. A number is only a signal if you've decided in advance what value should make you act.
"Track waste %" is not a signal. "Alert me when any single SKU's waste crosses 15% for two weeks running" is a signal. The second version has a threshold, a persistence rule, and an implied owner. That's the difference.
A practical starting set of signals for a small-to-mid bakery:
| Metric | Threshold that triggers a signal | Why this threshold |
|---|---|---|
| SKU waste % | >15% for 2 consecutive weeks | One bad day is noise; two weeks is a pattern |
| Attachment rate (coffee + pastry) | Drops below your 8-week average by 20% | Front-of-house or display change likely |
| Preorder fill rate | Below 95% | You're overpromising or under-producing |
| Labor % of sales | Above target band by 3+ points | Scheduling drifting from demand |
| Custom order margin | Below 40% on any order | Quoting or staging leaking money |
| Repeat-customer rate | Down 2 weeks in a row | Freshness or experience issue brewing |
The persistence rule matters more than people expect. Without it, you'll generate a new "urgent" signal every week from normal variance, your team learns to ignore alerts, and the whole system loses credibility inside a month. Set thresholds so that a signal firing genuinely means something changed, not just that Tuesday was rainy.
Step 2: Prioritize, because you can't test everything
A working signal system will surface more problems than a small bakery can act on. That's the uncomfortable part. If you've got three signals firing and one baker with bandwidth to run experiments, you need a ranking rule that isn't just "whatever bugged the owner most this week."
A simple scoring approach works well. For each active signal, score it 1–5 on three dimensions:
-
Money at stake — how much profit is this problem draining or leaving on the table?
-
Effort to test — how hard is it to run a clean experiment? Lower effort scores higher.
-
Reversibility — if the experiment fails, how easily do you revert? Easier revert scores higher.
Multiply or sum them, and you get a rough priority order. A high-money, low-effort, easily-reversible signal is the obvious first pick. A high-money but hard-to-reverse one—say, permanently cutting a product line—goes to the back until you're more confident.
In practice, this usually surfaces something counterintuitive. The problem that feels biggest often scores lower than a boring, chronic one like weekend pastry waste, simply because the waste is happening every single week and is easy to test against. Ranking forces you to chase recurring drains instead of dramatic one-offs.
Step 3: Turn the top signal into a scoped experiment
This is where most attempts fall apart. People take a signal and respond with something like "let's push the almond croissants more." That's not an experiment. It's a vibe.
A real experiment has five parts written down before you start:
-
Hypothesis — "Almond croissant waste is high because we're baking the same batch size on weekends as weekdays, despite lower weekend foot traffic in the last hour."
-
The change — cut the final weekend batch by 30% for three weeks.
-
Measurement — track weekend croissant waste % and stockout incidents.
-
Window — three weekends, no changes mid-stream.
-
Decision rule — "If waste drops below 10% and stockouts stay under 2 per weekend, adopt permanently. If stockouts exceed that, we cut too far—revert and try a 15% reduction instead."
Change one thing at a time so you can tell which lever moved the number.
The decision rule is the part almost everyone skips, and it's the most important piece. Without it, a "successful" experiment turns into an argument. With it, the numbers make the call and nobody has to win a debate. You wrote the rule when you were calm and objective; you honor it when the results come in.
The other discipline that matters: change one thing. If you cut batch size and move the display and drop the price in the same three weeks, you'll never know which lever moved the number. If you already run structured tests, the sample-size and seasonal thinking in a repeatable menu-engineering system applies directly here—the rigor is the same, just applied beyond the menu to your whole operation.
Step 4: Governance—who decides, and how the loop closes
Governance sounds heavy for a bakery, but it just means clear rules about who runs what, who calls the result, and where the learning gets stored. Without it, experiments become the owner's pet projects and nobody else touches the system.
A lightweight governance structure for a single-site bakery:
-
One experiment owner at a time. Usually the manager or a lead baker. They run it, collect the numbers, and bring the result to the weekly meeting.
-
A cap on concurrent experiments. Two, maybe three max for a small team. More than that and you can't isolate effects or keep normal operations stable.
-
A standing five-minute slot in the weekly meeting
what fired, what's running, what closed, what was decided.
-
A single experiment log everyone can see—hypothesis, change, result, decision.
The experiment log is worth dwelling on. Bakeries that keep even a scrappy log stop repeating failed ideas. When someone says "we should try discounting day-old bread at 4pm," the manager can pull up the log and say "we tested that in March—margin dropped and it just shifted sales from full-price morning loaves. Here's what we did instead." That institutional memory is quietly one of the highest-return parts of the whole system.
Once you scale past one location, governance stops being optional. At multiple sites you need rules about which experiments run locally versus which get standardized after a win. A batch-size change that worked at one store might not transfer to a location with different foot traffic, so the loop at scale includes a "validate before rolling out chain-wide" gate.
A real scenario: chasing weekend waste
Consider a mid-sized bakery-café doing roughly $40k–$45k a month, with a weekend pastry problem nobody had properly diagnosed. Their POS pipeline flagged that laminated pastry waste—croissants, danishes—was sitting around 18–20% on Saturdays and Sundays, well above their weekday numbers, and had been for over a month.
Before the loop, the response would've been "bake less on weekends," applied vaguely and inconsistently. Instead they scoped it properly: the hypothesis was that the 2pm batch was too large for late-afternoon weekend traffic. The change was cutting only that batch by about 30% for three weekends. Measurement was waste % plus any stockouts before close.
Results over those three weekends: laminated waste dropped to around 9–11%, and there was a stockout only once—late on a single Sunday. By their pre-written decision rule, that was a clear adopt. The one stockout was inside tolerance. Rough math on recovered ingredient and labor cost put it somewhere in the range of $250–$350 a month, or around $3k–$4k annualized, from a change that took three weekends and one written page.
The number isn't the impressive part. The impressive part is that the same team had "known" about weekend waste for months and never fixed it, because nothing forced the observation into a test. The loop did.
When this makes sense—and when it doesn't
This makes sense when:
-
You already have reasonably reliable data on a weekly cadence. Garbage in, garbage experiments.
-
You have at least one person with the bandwidth and temperament to own experiments and respect decision rules.
-
Your recurring problems are operational and testable—waste, staffing fit, attachment rates, fill rates.
This is a bad idea when:
-
Your data is a mess and you're not tracking anything consistently yet. Fix the pipeline first; a loop built on unreliable numbers just generates confident wrong decisions.
-
You're in genuine firefighting mode—equipment failing, cash crunch, staffing crisis. Stabilize before you optimize.
-
Nobody will honor the decision rules. If every result becomes a debate the owner wins by seniority, you don't have a governance loop, you have theater.
Who should probably not run the full system: a brand-new bakery still finding its footing. At that stage your baseline is changing too fast for clean experiments—your "signals" are just the normal chaos of a new business. Run the loop once your week-to-week numbers have settled into something recognizable.
Where automation quietly earns its keep
You can run this entire loop on spreadsheets and a whiteboard, and plenty of bakeries should start exactly there. But there are two spots where it tends to break under manual effort.
The first is signal detection. Nobody wants to manually check twelve thresholds across dozens of SKUs every week, so in practice they don't, and signals get missed. An operational platform that watches your metrics and flags threshold breaches automatically removes human forgetfulness from the equation—the alert fires whether or not anyone remembered to look.
The second is closing the loop. Keeping the experiment log current, nudging the owner when a measurement window ends, surfacing "this was tested before" when someone proposes a repeat—that's the kind of connective-tissue work that AI-assisted operational tools handle well, because it's tedious and easy to drop under pressure. The judgment calls are still yours. It just makes sure a signal never dies in silence and a result never gets forgotten.
Used this way, automation isn't running your bakery. It's making sure the loop actually loops—which, if you've ever watched a good idea evaporate between two busy weeks, you know is harder than it sounds.
Closing the gap between knowing and doing
The bakeries that improve steadily aren't the ones with the fanciest dashboards. They're the ones with a short, reliable path from a number changed to we tested a response to here's what we decided and why.
Start small. Pick three signals with real thresholds. Score them, take the top one, and run a single scoped experiment with a decision rule you write before you begin. Log the result whether it works or not. Do that for a few cycles and you'll have something most bakeries never build: a system that turns the same weekly numbers you already have into a steady stream of small, compounding operational wins.
Start small. Pick three signals with real thresholds. Score them, take the top one, and run a single scoped experiment with a decision rule you write before you begin. Log the result whether it works or not. Do that for a few cycles and you'll have something most bakeries never build: a system that turns the same weekly numbers you already have into a steady stream of small, compounding operational wins.
Ready to elevate your bakery operations?
Join 2,000+ bakeries using Bakeryly to streamline workflows, reduce waste, and delight more customers.