


Most bakery POS systems generate reports like a broken faucet—endless streams of data that nobody actually uses. Transaction logs, hourly sales breakdowns, category performance metrics, all sitting in export folders while decisions get made based on gut feel and whatever the morning shift lead remembers from yesterday.
The problem isn't lack of data. It's that raw POS dumps don't answer the questions that actually matter on a Monday morning. Should you cut the sourdough starter batch by 20%? Are afternoon pastry sales trending down enough to reduce evening prep? Is that new sandwich actually profitable after accounting for prep time, or just moving units?
Too many bakery owners export their Saturday sales report, stare at seventeen columns of numbers, then make the same production quantities they made last week anyway. The data exists, but without a proper bakery POS data pipeline, it might as well not.
Why bakery data breaks differently than other retail
Bakery operations create data challenges that generic POS analytics can't handle. A croissant sold at 7am and a croissant sold at 3pm aren't the same product—one was fresh from the oven, the other has been sitting for eight hours. Your POS sees them as identical SKUs.
Food cost calculations get messy when a single batch of dough becomes three different products. That brioche dough might become dinner rolls, burger buns, and french toast loaves. Your POS tracks the final sale but has no visibility into the shared production cost upstream.
Then there's waste that never hits the POS at all. The burnt batch of cookies, the sourdough that overproofed, the danish that didn't sell by close—none of this shows up in standard sales reports. You're making decisions based on what sold, not what you actually produced.
Most POS systems also miss the timing element completely. They'll tell you that you sold 47 chocolate croissants yesterday, but not that 31 of them sold before 9am while the afternoon shift threw out 8 unsold ones. That's a production planning problem hiding inside a sales success story.
Seasonal patterns matter too. A regular retail store might see predictable weekly cycles, but bakeries deal with weather-driven demand swings (nobody wants heavy pastries on a 95-degree day), holiday spikes that require ingredient pre-ordering, and local events that can triple foot traffic without warning.
The lightweight pipeline that actually gets used
After building data systems for bakeries ranging from single-location cafes to small regional chains, the same pattern shows up every time: simple beats sophisticated. The expensive analytics platform with predictive modeling gets abandoned after a few weeks. The Google Sheet with four key metrics gets checked every morning.
Never miss a bake or delivery again.
Bakeryly helps you schedule, track, and manage every order effortlessly.
- Unified order tracking
- Real-time inventory alerts
- Staff shift management
No credit card required
Here's the pipeline structure that actually sticks:
Stage 1: Automated daily extract
Set your POS to auto-export three specific reports every night at close:
-
Transaction detail (every line item with timestamp)
-
Product mix by hour
-
Payment method summary
Skip the hundred other report options. These three contain most of what you need.
Stage 2: The cleaning table
This is where most pipelines fail—they try to be too clever. Your cleaning process needs exactly five transformations:
-
Map products to production categories. Your POS might have 47 different pastry SKUs, but for production planning you only care about 6 categories: laminated, cake-based, cookies, bread, sandwiches, beverages.
-
Add time buckets. Transform timestamps into operational periods
opening rush (6am-9am), morning (9am-12pm), lunch (12pm-2pm), afternoon (2pm-5pm), evening (5pm-close).
-
Calculate true product age. If you bake croissants at 5am and sell one at 4pm, that's an 11-hour-old product. This matters for quality perception and pricing decisions.
-
Group by production batch requirements. A dozen different cookie varieties might all come from three base doughs. Group them accordingly.
-
Flag weather and events. Add a simple column for weather (hot/mild/cold/rain) and local events. You'd be amazed how much this improves pattern recognition over time.
Stage 3: Alert thresholds that prevent surprises
Forget complex anomaly detection. You need five simple alerts:
| Alert Type | Threshold | Action Trigger |
|---|---|---|
| Morning rush shortage | <70% of items available by 7am | Adjust production start time |
| Afternoon dead zone | <$50 revenue 2pm-4pm for 3 days | Test happy hour pricing |
| Category imbalance | One category >40% of sales | Menu rebalancing needed |
| Waste spike | >15% of production unsold | Batch size adjustment |
| New item flop | <10 units/day after week 2 | Remove or reposition |
These aren't perfect statistical models. They're practical triggers that catch problems before they get expensive.
Stage 4: The Monday morning decision workbook
Every Monday, your pipeline should generate a single page with four sections:
Last week's three surprises
-
What sold way more than expected?
-
What died on the shelf?
-
Which hour had the biggest gap between production and demand?
This week's three experiments
Based on last week's data, pick three small tests:
-
Reduce Tuesday morning Danish by 20%
-
Add afternoon cookie multi-pack discount
-
Start sourdough 30 minutes earlier
Production adjustments
Simple percentage changes to standard batch sizes based on trailing 3-week average, capped at 20% change per week to avoid overreaction.
Watch list
Three items showing weird patterns that need human investigation. Maybe the new barista is entering croissants as muffins, or the afternoon shift started giving away day-old pastries without recording them.
Visual summary of the pipeline workflow:
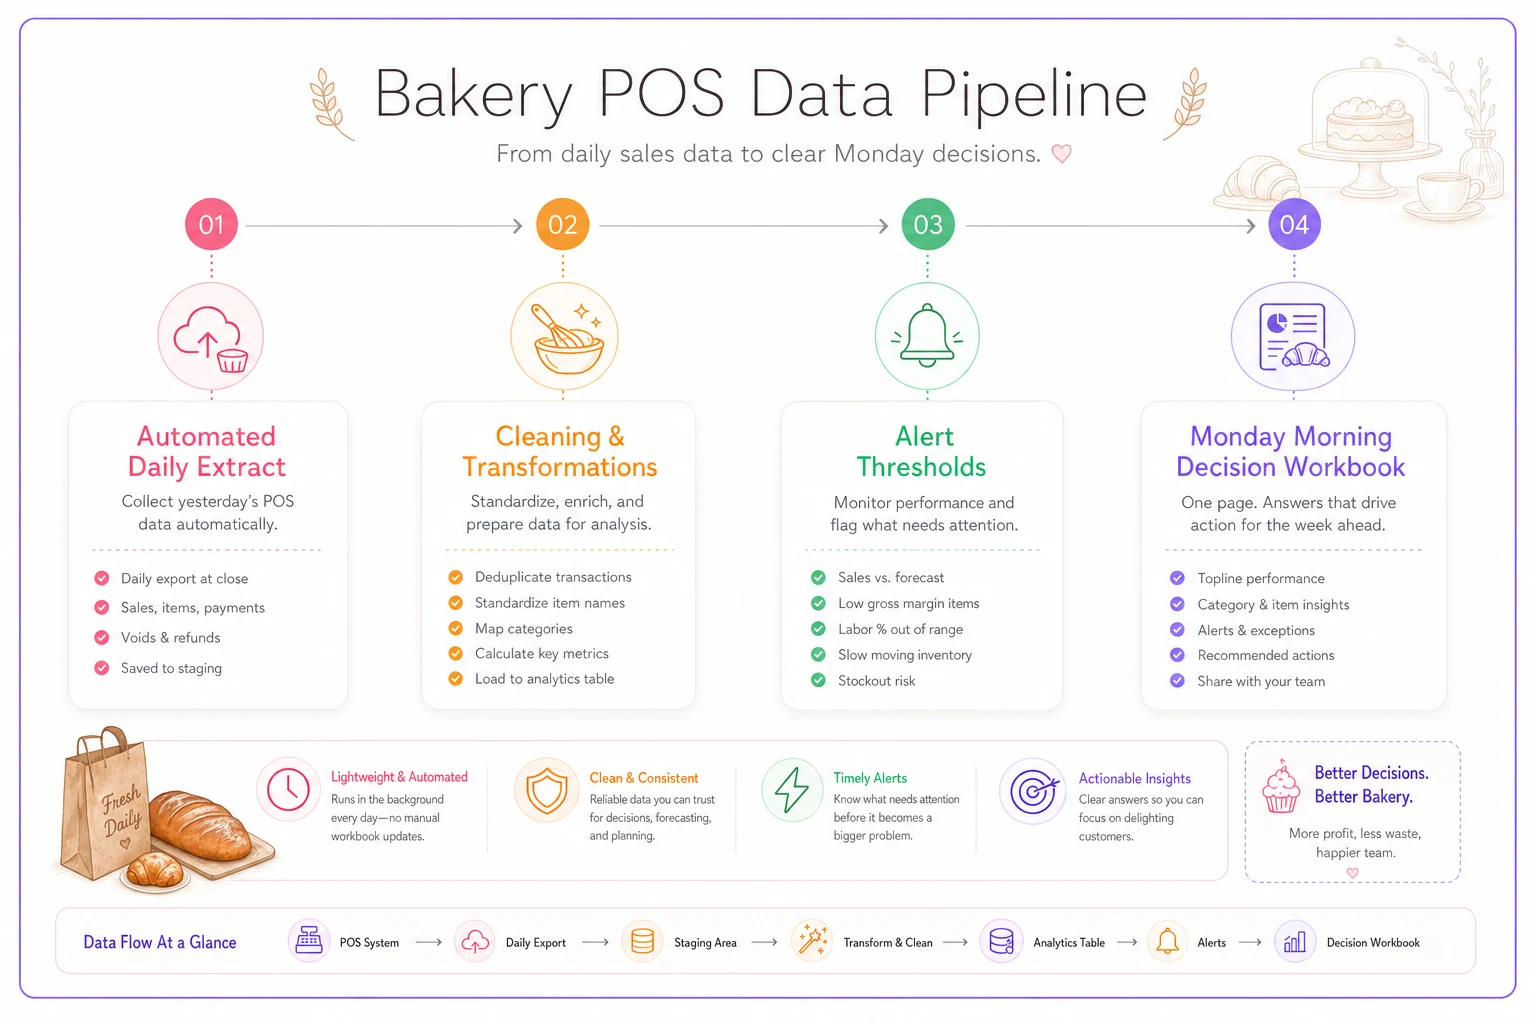
Start by automating only the three nightly exports before adding more complexity.
Keep this one-page output front and center for Monday morning planning and staff discussions.
ETL checks that catch data problems before they cascade
Bad data is worse than no data because it creates false confidence. Your pipeline needs basic sanity checks that run automatically:
Daily total bounds: If yesterday's revenue is 50% higher or lower than the same day last week, flag it for manual review. POS crashes, forgotten end-of-day procedures, or staff still learning the register can all create anomalies.
Missing hours: If any hour between open and close shows zero transactions, something's wrong. Even the slowest afternoon should have at least one coffee sale.
Product mix stability: If croissants suddenly jump from 15% to 45% of sales, there's either a data entry problem or something dramatic happened that needs investigation.
Round number frequency: Too many transactions ending in .00 suggests staff are using quick-keys incorrectly or the POS is dropping decimal places.
None of these checks require statistical sophistication. They're just common-sense flags that something needs human attention before the data feeds into decisions.
Alert templates for the five critical bakery moments
Not all alerts deserve equal attention. These five situations need immediate notification:
The morning disaster prevention (Check at 6:30am)
-
Display case less than 60% full
-
Coffee machine error codes
-
Register offline for >10 minutes
-
Temperature alerts from refrigeration
Text the owner and shift lead immediately. Every minute counts in the morning rush.
The afternoon pivot (Check at 1pm)
-
Morning items still >50% unsold
-
Lunch items already sold out
-
Next day's special orders not confirmed
-
Unusual payment method patterns (might indicate POS issues)
This gives you three hours to adjust afternoon production or create promotions to move excess inventory.
The pre-close waste reduction (Check at 2 hours before close)
-
Items approaching day-old status
-
Sufficient inventory for expected final rush
-
Tomorrow's prep list generated
-
Unusual refund patterns
The goal is reducing waste while avoiding the stockouts that frustrate late customers.
The weekly trend break (Check Monday morning)
-
Any category down >20% week-over-week
-
New items underperforming after launch week
-
Steady waste increase for 3+ weeks
-
Customer count trending opposite of revenue
These patterns usually point to operational issues beyond normal variation.
The monthly margin check (First Monday of month)
-
Food cost percentage creeping up despite stable prices
-
Labor hours increasing faster than sales
-
Average transaction value declining
-
Category mix shifting toward lower-margin items
Monthly checks catch the slow bleeds that kill profitability quietly over time.
A decision-loop workbook with concrete weekly tasks
The best bakery POS data pipeline in the world is worthless if it doesn't drive actual operational changes. Here's a weekly rhythm that turns data into decisions:
Monday: Analyze and adjust
-
Review the weekend's performance (your highest volume days)
-
Identify the single biggest opportunity from the data
-
Adjust one production quantity by 15-20%
-
Document the change in a simple log
Tuesday: Test small changes
-
Pick your slowest product category
-
Run a 2-hour promotion or bundle test
-
Track results manually if needed
-
Decision by end of day
expand, modify, or abandon
Wednesday: Mid-week corrections
-
Check if Monday's adjustments are holding
-
Review special orders for the weekend
-
Adjust Thursday/Friday production based on actuals vs. plan
-
Flag any weekend staffing concerns early
Thursday: Prep for weekend surge
-
Verify all weekend ingredients are available
-
Check if last weekend's pain points were addressed
-
Review weather forecast and local events
-
Set production schedules for Friday night prep
Friday: Lock and load
-
Morning
Final weekend production quantities locked
-
Afternoon
Review week's experiments and document learnings
-
Evening
Ensure all systems are capturing data correctly
-
Last check
Tomorrow's opening shift has clear priorities
Saturday/Sunday: Observe and note
-
Watch for patterns the data might miss
-
Note any customer complaints or requests
-
Track operational hiccups
-
Keep a simple list for Monday's review
This isn't a complex process. It's a rhythm that builds data-driven decision making into your operational muscle memory.
Converting dusty reports into profitable decisions
The transformation from unused POS reports to actual operational improvements doesn't happen overnight. Most bakeries take 6-8 weeks to really hit their stride with a new data pipeline. The key is starting simple and building habits before adding sophistication.
Start with one metric that matters. For most bakeries, that's the morning availability rate—what percentage of your display case is full when the morning rush hits. Track just this for two weeks. Once you're checking it daily and adjusting production accordingly, add the afternoon waste percentage. Build from there.
The cleaning and transformation steps seem tedious, but they're what separate useful insights from numerical noise. That mapping of 47 SKUs down to 6 production categories? It'll save hours of confusion when you're trying to figure out why food costs spiked.
Your alert thresholds will need tuning. The 15% waste threshold might be too tight for a bakery with lots of decorated items, too loose for one focused on bread. Start with reasonable guesses and adjust based on what actually drives action.
When automation makes the difference
A manual version of this pipeline—exporting reports, updating spreadsheets, checking thresholds—takes roughly 45 minutes daily. That's 5 or so hours per week of relatively tedious work that could be spent on actual baking or customer service.
This is where modern operational software earns its keep. AI-powered platforms can handle the entire extract-transform-load process automatically, run threshold checks continuously, and generate your Monday morning decision workbook without any manual intervention. The same automation that handles the data pipeline can also surface patterns humans tend to miss—like the correlation between Tuesday's rain and Thursday's soup sales, or the relationship between morning pastry mix and afternoon coffee velocity.
Automated systems also don't skip days when things get busy. They don't forget to check alerts during a holiday rush. They don't accidentally transpose numbers when copying data between systems. The consistency alone often justifies the investment, before you even factor in time savings.
Some bakeries connect their POS data pipeline to other operational systems—linking sales patterns to production schedules, automatically adjusting par levels, or triggering reorder points based on velocity trends. But even without that level of integration, just having clean, consistent, actionable data every morning changes how you run the business.
Why most bakeries never build this (and stay in the dark)
The biggest barrier isn't technical complexity or cost. It's the gap between wanting data-driven decisions and actually changing behaviors when the data says something uncomfortable. Every bakery owner says they want better reporting, but when the reports suggest cutting their signature item's production by 30%, emotion often overrides analysis.
There's also the "perfect system" trap. Bakeries delay implementing any data pipeline because they're waiting for the right POS, or the ideal analytics package, or next quarter when things settle down. Meanwhile, daily decisions get made completely blind.
Staff resistance is real too. A morning shift lead who's been reading the rush for fifteen years won't immediately trust what a spreadsheet says. The key is positioning the pipeline as a tool to confirm their instincts, not replace them. When the data backs up what they already suspected, buy-in grows on its own.
Starting tomorrow: your first pipeline steps
Don't overthink this. Tomorrow morning, export yesterday's transaction detail from your POS. Dump it into a spreadsheet. Count how many croissants sold before 9am versus after 2pm. That single insight might change your production schedule.
Next week, add the weather. Was it raining? Hot? Note it in the spreadsheet. After a month, you'll see patterns you've never noticed despite working every day.
Build the habit before the system. Once checking these numbers becomes as routine as checking morning par levels, you can add sophistication—automated exports, threshold alerts, maybe eventually predictive modeling. But start with the discipline of looking at data daily.
The gap between bakeries that thrive and those that struggle often comes down to operational visibility. You can't fix problems you can't see. A simple bakery POS data pipeline—even a manual one in Google Sheets—gives you the visibility to make better decisions every single day.
Your POS is already collecting the data. The question is whether you'll use it, or let it collect dust while you operate on instinct alone. In a business where 2-3% margin improvements mean the difference between profit and loss, that's not a small thing.
The reporting systems that actually drive decisions aren't complex dashboards with fifty metrics. They're simple pipelines that answer the questions you face every Monday morning. What should I bake less of? What needs better placement? When should I start morning production?
Build the pipeline that answers those questions, and you move from reactive to proactive, from guessing to knowing. Your POS is trying to tell you something—and if you're also thinking through how to systematically test and refine your menu based on what the data surfaces, even better. Most owners never connect those two things. The ones who do tend to stick around.
Ready to elevate your bakery operations?
Join 2,000+ bakeries using Bakeryly to streamline workflows, reduce waste, and delight more customers.