


When a bakery runs one location, finance is honest in a way nobody appreciates until it's gone. One oven, one cash drawer, one flour order. Money in, money out, and you can feel whether the week went well before the numbers even confirm it.
The second site changes the math in a way most owners don't see coming. Suddenly there's a commissary baking for two cafes, a van running product between them, shared marketing spend, and one bookkeeper trying to figure out which location "owns" the $4,200 flour invoice that fed both shops. The books still close, technically. But the per-site P&Ls start lying to you. And when your numbers lie, you make staffing and pricing decisions based on fiction.
This is the part of scaling nobody warns you about. The production side gets all the attention — recipes, capacity, logistics. The finance governance side, meaning the actual rules for how money gets attributed across sites, quietly rots until one site looks unprofitable on paper and you almost close it, when really it was just eating costs that belonged somewhere else.
Here's how the whole system works, where it breaks, and the allocation logic and monthly reconciliation cadence that keeps network finance governance honest as you grow.
The core problem: your sites share more than you think
A single-site bakery has clean boundaries. A multi-site network is a web of shared resources, and almost none of them split cleanly.
-
Shared production. A central kitchen bakes croissants for three retail fronts. Whose labor is that? Whose gas bill?
-
Inter-site transfers. Site A sends 200 baguettes to Site B because B's oven went down. At what price does that transfer get recorded — cost, retail, or something in between?
-
Shared overhead. One accountant, one marketing budget, one liability insurance policy, one software subscription stack. Split evenly? By revenue? By headcount?
-
Procurement. You negotiate a better flour rate because you now buy for the whole network. Which site "earns" the savings?
The instinct is to not bother — throw everything into one consolidated P&L and look at the network total. That works right up until one site underperforms and you can't tell whether it's the location, the manager, or an accounting artifact. Consolidated-only financials hide the exact information you need to run sites as accountable units.
The opposite instinct — tracking everything to the penny per site — is worse. Owners build 40-tab spreadsheets allocating office printer toner across four locations, and the system collapses within two months because nobody can maintain it. The goal isn't perfect allocation. It's consistent, defensible allocation that someone can actually reproduce every month.
Why this breaks across almost every growing bakery
The pattern is remarkably consistent. It's not a math problem. It's a rules problem.
Most bakeries never write down allocation rules because when they were one site, they didn't need any. So when the second and third sites arrive, allocation happens ad hoc — whoever's doing the books that month makes a judgment call, and next month someone makes a different one. The flour invoice gets dumped on Site A in January and split 50/50 in February, and nobody notices because nobody's comparing.
Then you try to evaluate a manager's performance, or decide where to invest, and the per-site numbers are internally inconsistent. The commissary site always looks like a money pit because it carries all the production cost and books revenue at cost when it transfers goods out. The retail sites look like heroes because they book full retail revenue on product they barely touched. None of it reflects reality.
This is the same root issue behind margin erosion in a single shop — you can't control what you can't see cleanly — except multiplied by the number of sites and the shared resources between them. If you haven't locked down the fundamentals yet, the simple financial-control system a small bakery can run without an accountant is the single-site foundation this whole article builds on. Network governance on top of a shaky single-site control system just scales the mess.
The allocation framework: three buckets, three heuristics
Stop trying to allocate everything with one method. Costs fall into three buckets, and each gets a different heuristic.
Bucket 1: Direct costs — trace them, don't allocate them
Anything that can be traced to a single site goes there, full stop. Site-specific rent, that site's hourly staff, its utilities if separately metered, its POS fees, its local delivery costs. No splitting, no cleverness. If you can tie it to one location with an invoice or a timesheet, it lives there.
The mistake here is overthinking it. People try to allocate things that are genuinely direct because the invoice came in under a network account. If the flour went to one kitchen, it's a direct cost of that kitchen even if you paid for it on the central card.
Bucket 2: Shared-production costs — allocate by usage driver
This is the commissary problem. A central kitchen produces for multiple sites, so its costs — baker labor, oven gas, mixing equipment depreciation, the production floor's rent — have to flow out to the sites that consume the output.
Allocate these by a usage driver that reflects actual consumption. The three that work for bakeries:
| Cost type | Best allocation driver | Why it works |
|---|---|---|
| Baker labor & production overhead | Units produced per site (weighted by complexity) | A croissant takes more labor than a loaf; weight accordingly |
| Shared oven gas / energy | Oven-hours or tray-count per site | Energy tracks heat time, not revenue |
| Commissary rent & equipment | Production volume share (rolling 3-month) | Smooths out weekly spikes |
| Shared delivery van | Stop count or route miles per site | Reflects who actually uses the driver |
The "weighted by complexity" part matters more than people expect. If you allocate commissary labor by raw unit count, a site selling mostly simple loaves gets overcharged and a site selling laminated pastry gets a free ride. Build a rough complexity multiplier — a plain loaf at 1.0, a croissant at 2.5, a decorated cake at 6.0 — based on actual production minutes. It doesn't need to be precise. It needs to be directionally honest and consistent month to month.
Keep the complexity multipliers simple and stable month to month to avoid constant re-fighting.
Bucket 3: Network overhead — allocate by a simple, stable base
The owner's salary, central bookkeeping, network marketing, insurance, the software stack. These don't track to production at all. Allocate them by a single stable base — usually net revenue share — and don't overthink it.
Revenue share is defensible, easy to compute, and roughly tracks each site's size and ability to absorb overhead. Some owners prefer an even split or a headcount split, and those work too, as long as you pick one and hold it. The worst outcome is switching the overhead base between months, because then per-site profit swings for reasons that have nothing to do with operations.
Transfer pricing: the rule that prevents the most fights
Inter-site transfers are where multi-site finance quietly goes sideways, and where managers start distrusting the numbers.
Say your commissary bakes sourdough and ships it to three cafes. If you record that transfer at cost, the commissary shows zero margin on everything it produces — it looks like a perpetual loss center, and the cafes look artificially profitable. If you record it at full retail, the commissary books phantom profit it never collected from a customer, and the cafes get crushed on paper.
Transfer at standard cost plus a fixed production margin. Set a transfer price equal to the fully-loaded production cost (ingredients + allocated production labor + allocated commissary overhead) plus a modest, fixed markup — commonly 10–20% — that represents the commissary's "job" of producing efficiently.
This does three things:
-
The commissary gets evaluated on whether it produces below its standard cost. If standard cost for a loaf is $1.40 and they make it for $1.25, that's real, visible efficiency.
-
The receiving cafe carries a realistic cost of goods, so its retail margin reflects the actual spread it manages.
-
Neither site can hide inside the other's numbers.
The key discipline: set standard costs in advance, review them quarterly, and don't renegotiate them mid-month because one site had a bad week. A transfer price that moves whenever someone complains isn't a price — it's a negotiation, and it destroys comparability.
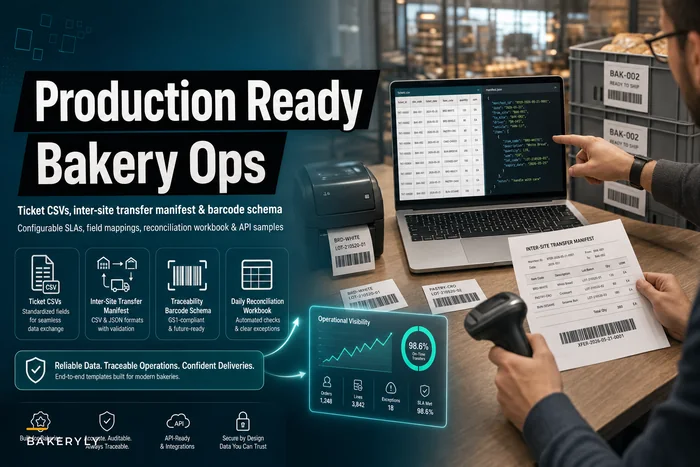
If your physical transfer process is loose — product moving between sites without clean documentation — the finance side will never reconcile no matter how good your rules are. The inter-site transfer manifest templates give you the CSV/JSON structure to capture what moved, when, and at what standard cost, which is exactly the data your monthly close needs.
When standard-cost transfer pricing is a bad idea
Not every network needs this. If your sites are genuinely independent — each bakes its own product, no commissary, minimal transfers — skip transfer pricing entirely and just run direct costs per site. Building transfer-price machinery for two self-sufficient shops is pure overhead with no payoff. This matters when you have a hub-and-spoke model where one kitchen feeds several fronts. If you don't have a hub, you don't have this problem.
Tying finance to operations: the KPIs that connect both sides
The gap that kills most reconciliation efforts: the finance numbers and the operations numbers are tracked by different people in different systems and never meet until something's already wrong.
A clean network finance system forces finance and operations KPIs to reconcile against each other every month. Each pair should agree — and when they don't, the gap is the signal.
-
Waste % (ops) vs. COGS variance (finance). If the kitchen reports 6% waste but food cost came in 4 points over standard, the extra cost is hiding somewhere the waste log didn't capture — theft, portioning drift, or unrecorded transfers.
-
Units transferred (ops manifests) vs. inter-site revenue booked (finance). These must tie out. If 200 loaves left the commissary but only 180 got billed to the cafe, you have a leak.
-
Labor hours scheduled (ops) vs. labor cost allocated (finance). A site whose allocated labor outruns its scheduled hours is absorbing someone else's cost.
-
Fill rate (ops) vs. lost-sales estimate (finance). Low fill rate at a cafe that's still "profitable" may mean it's under-ordering and quietly capping its own revenue.
The point of a reconciliation playbook isn't to produce a report. It's to make these pairs collide on purpose so discrepancies surface while they're still small.
The monthly reconciliation playbook
Run it in this order — the sequence matters because each step feeds the next.
-
Lock the transfer manifests (Day 1). Pull every inter-site transfer for the month, confirm quantities against receiving-site logs, and apply standard transfer prices. Any mismatch between what shipped and what was received gets investigated before anything else, because it corrupts both sites' numbers.
-
Assign direct costs (Day 1–2). Post every traceable invoice and timesheet to its home site. No allocation yet. Flag anything that landed on the central account but belongs to one site.
-
Run shared-production allocation (Day 2). Apply the usage-driver splits — units produced (complexity-weighted), oven-hours, delivery stops — to push commissary costs out to consuming sites.
-
Apply network overhead (Day 2). Spread central overhead by your chosen stable base (usually revenue share). One formula, applied the same way as last month.
-
Build per-site P&Ls (Day 3). Now each site has a full picture: direct + allocated production + allocated overhead + transfer revenue/cost.
-
Run the KPI reconciliation (Day 3). Line up each finance figure against its operational twin from the list above. Document every gap over your threshold — say, anything above 1.5% of site revenue.
-
Investigate the top three variances (Day 4). Don't chase everything. Rank the gaps by dollar size and dig into the three biggest. Most months, two of them are data-entry errors and one is a real operational issue worth fixing.
-
Write the one-page variance note (Day 4). Per site
what the numbers say, what the biggest gap was, and what you're changing. This is the document that makes next month faster.
Owners who run this consistently find the close gets dramatically faster after three or four cycles, because the recurring errors get designed out. The first month is painful. The fourth month takes an afternoon.
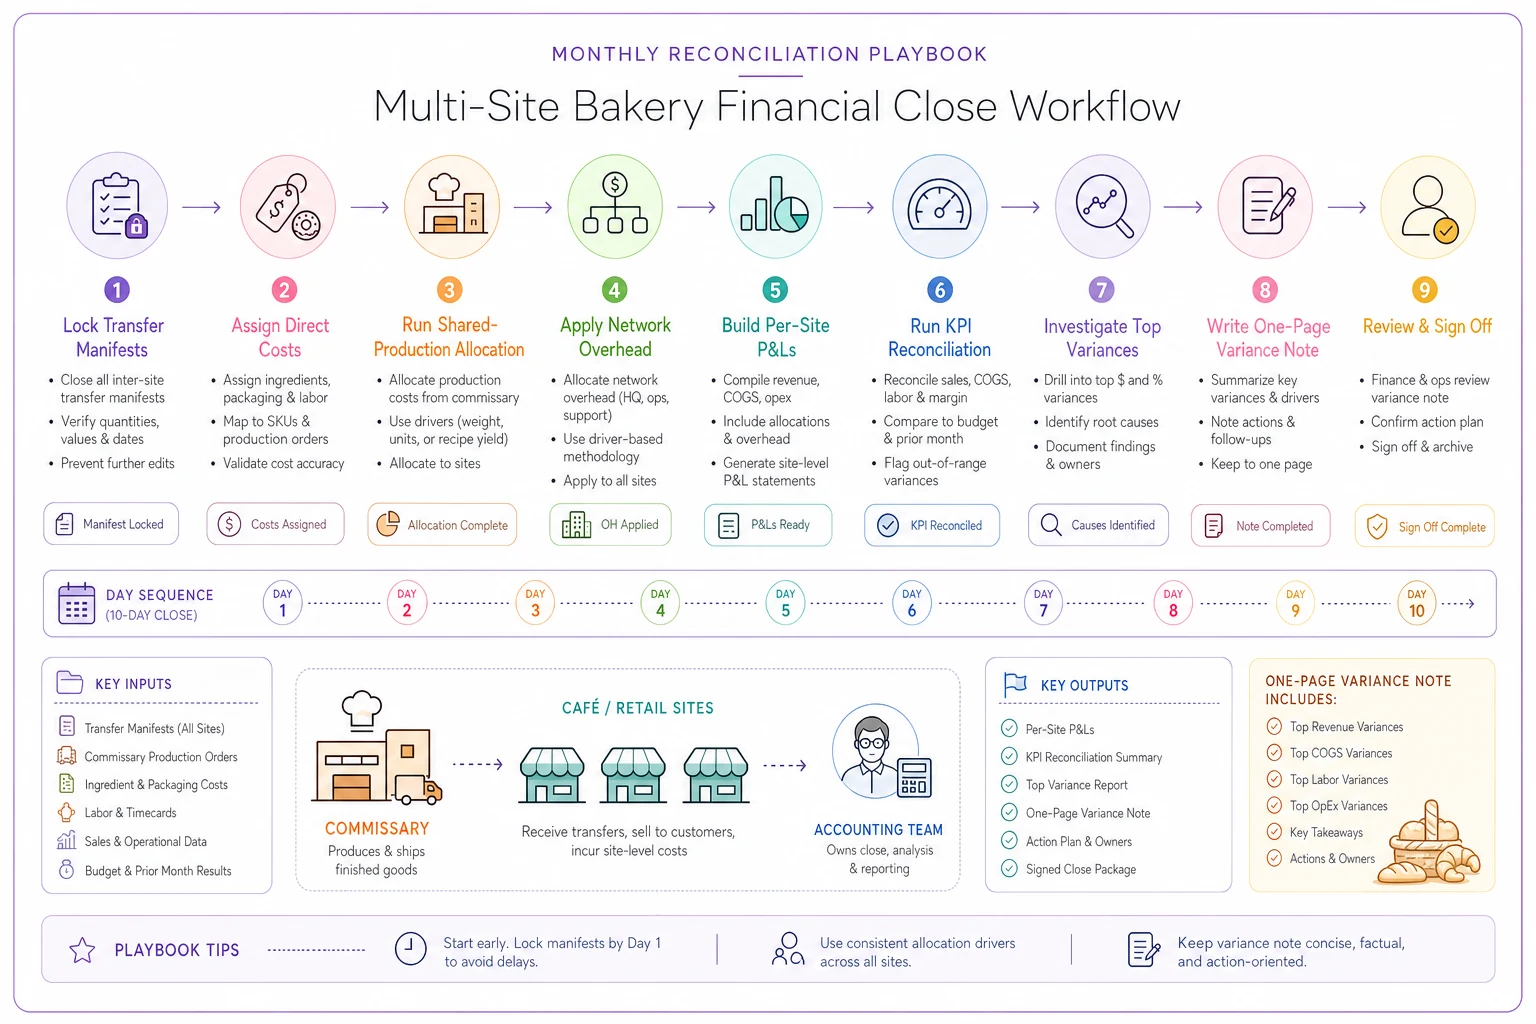
A simple visual of the steps makes the sequence obvious and shows where data hand-offs happen.
A worked example
Three-site network: one commissary (C) and two cafes (North and South).
For the month, the commissary's fully-loaded production cost was about $38,000. It produced, complexity-weighted, roughly 60% of its output for North and 40% for South. So production cost allocates around $22,800 to North and $15,200 to South.
Transfers were priced at standard cost plus 15%. North received product with a standard cost of ~$22,800, billed at ~$26,200. South received ~$15,200 worth, billed at ~$17,500. The commissary therefore shows around $5,700 in production margin — the right signal: it's being measured on whether it produced below standard, not on retail it never earned.
Network overhead for the month was about $14,000 (owner draw portion, bookkeeping, insurance, software, network marketing). North did roughly $58k in revenue, South roughly $42k — a 58/42 split. North absorbs ~$8,100 of overhead, South ~$5,900.
Then the reconciliation catches something. South's waste log reported 5%, but its COGS ran about 3 points high. That's roughly a $1,300 gap on South's food cost. Digging in: a batch of transfers arrived from the commissary two days before a slow weekend, didn't sell, and got written off at South — but the commissary had already booked the transfer revenue. The product was real, the loss was real, but it landed on South because of timing, not because South ran a bad operation.
Without the reconciliation step, South's manager takes the hit on paper and gets told to tighten up. With it, the actual fix surfaces: transfer timing and quantities need to match South's demand curve, not the commissary's baking schedule. That's a scheduling fix, not a blame conversation.
What changes as you add more sites
Two sites, you can run most of this in a well-built spreadsheet. The allocation math is simple and the volume of transfers is small enough to eyeball.
At four or five sites, the transfer web gets dense — dozens of inter-site movements a week, each needing a standard cost applied and reconciled against a receiving log. The spreadsheet starts breaking not because the math is hard but because the data entry and matching volume overwhelms a manual process. This is the exact point where the operating model itself needs rethinking, which is covered in the guide on scaling a bakery to multiple sites and choosing a central-vs-local model.
What tends to break, in order:
-
Transfer matching. Ships and receipts stop tying out because no one has time to check every manifest line.
-
Allocation consistency. A new bookkeeper joins and quietly changes the overhead base, and three months of comparability evaporate.
-
KPI reconciliation gets skipped. It's the first step to go when the close is under time pressure, which means variances stop surfacing until they're large.
The structural answer is to move the repetitive, error-prone matching work off people entirely. An operational platform that connects your production logs, transfer manifests, and site-level sales into one reconciled view earns its keep here — not because software is magic, but because matching "what shipped" to "what was received" to "what was billed" is pure rules-based work that machines handle without fatigue, and that humans do inconsistently at volume. The judgment stays with you; the tedious cross-checking gets handled automatically, so the variance report is already built instead of you spending four days assembling it.
Who should NOT build this yet
If you're running a single site, this is premature. Nail your single-site financial controls first.
If you have two fully independent sites with no commissary and almost no transfers, skip the transfer-pricing and shared-production machinery entirely. Run clean per-site direct costs, allocate network overhead by revenue, and reconcile the two KPI pairs that actually apply to you. Building hub-and-spoke finance for a network that isn't hub-and-spoke is effort with no return.
And if your single-site books are still messy — unreconciled cash, fuzzy food cost, unclear margins — fix that before anything else. A network reconciliation playbook can't clean up data that was dirty on the way in.
Closing the loop
The real value here isn't the allocation formulas, though you need them. It's the discipline of making finance and operations check each other every single month. When the waste log and the COGS variance have to reconcile, when shipped units have to match billed units, when allocated labor has to track scheduled hours — the gaps between those numbers become your early-warning system. They tell you where product is leaking, where a site is quietly under-ordering, where a transfer schedule is out of sync with real demand.
A multi-site bakery that runs this cadence stops guessing which location is actually healthy. You can evaluate managers fairly, invest where the returns are real, and catch a leak at $1,300 instead of discovering it at $13,000 three months later. The formulas keep the numbers honest. The monthly collision of finance and ops is what keeps the business honest.